What a good impact report does
An impact report is not the annual accounts and not a brochure. It has three jobs, and the strongest examples below do all three.
1. Prove
Show what changed, with numbers a reader can repeat and enough context to trust them: the baseline, the period, what counts. A figure on its own is a claim. A figure in a sentence is evidence.
2. Thank
Donors, partners, volunteers and staff should be able to find their part in the year. That means names, places and at least one person whose life the work touched, not a logo wall.
3. Invite
Every report is read by someone deciding whether to give, fund, join or partner next year. Tell them what comes next and give them one clear way to act on it.
A PDF can do the first job. The second and third work better on a page people open on their phone, share by link, and reach from a newsletter or a donate page.
The 15 examples below are grouped by sector. Each was opened and read in November 2026, and each is tagged by format: a scroll story (one page designed to be scrolled screen by screen), a microsite (its own site or subdomain, with chapters), or a long page on the organization's main site.
Nonprofit impact report examples
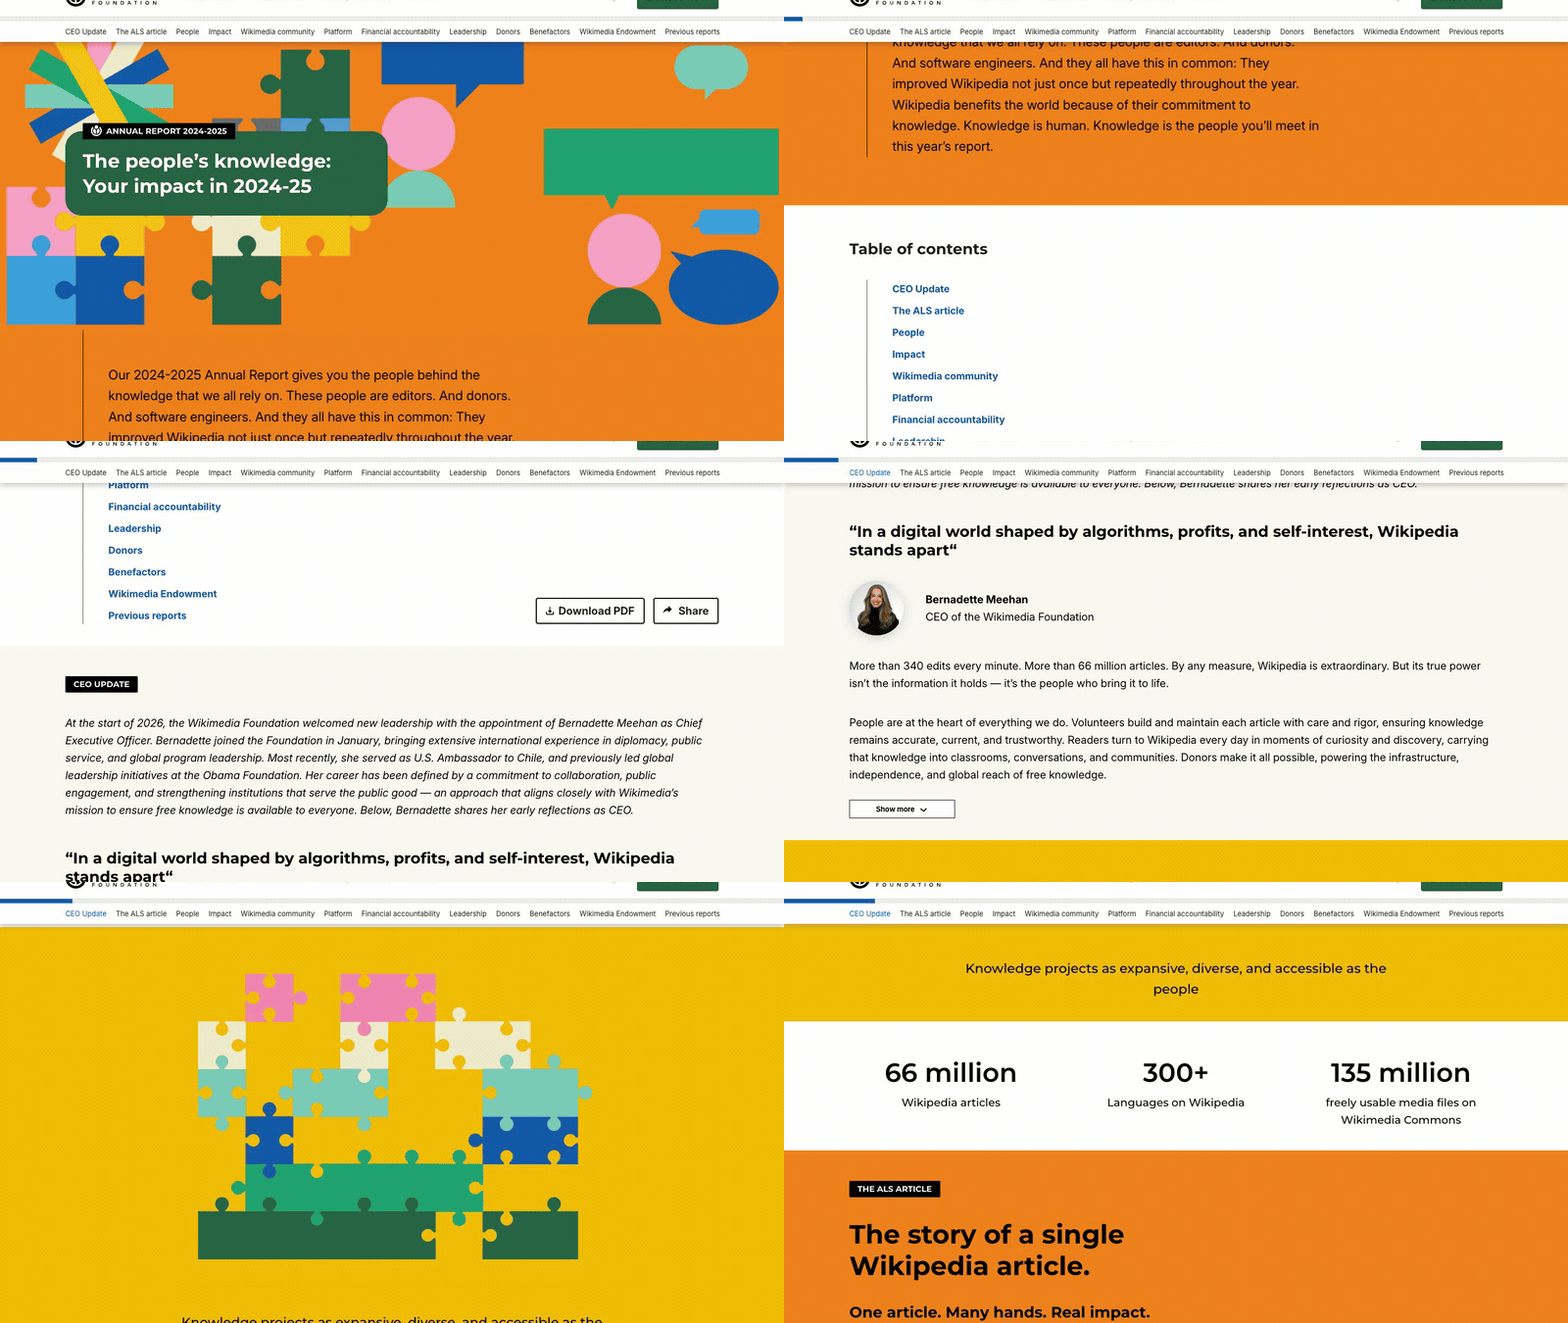
1. Wikimedia Foundation: Annual Report 2024–2025
Visit site ↗What works: The report tells the year through one Wikipedia article, the entry on ALS: its story, the people behind it, its edit history and its impact. A table of contents with jump links, a map of volunteer stories and audited financials beside the prior year make it as useful to a journalist as to a donor. The PDF is offered, not required.
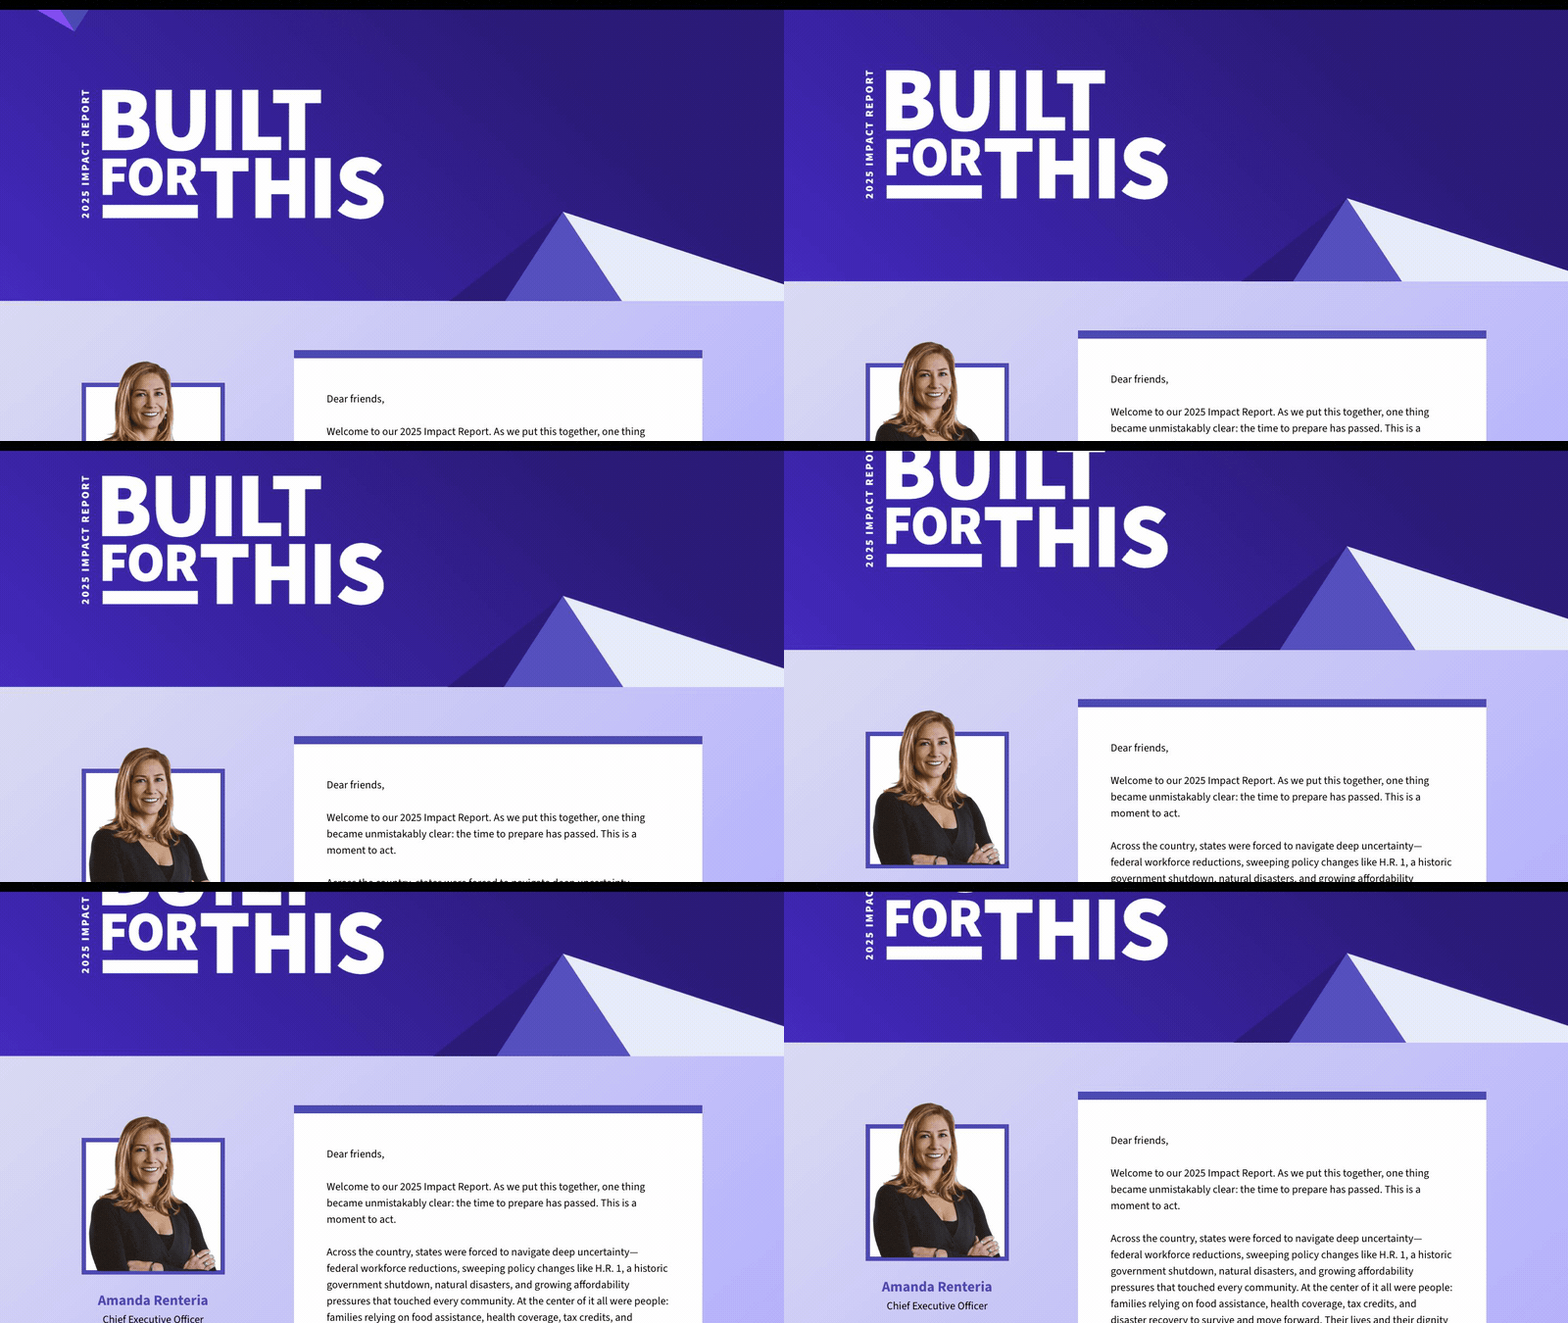
2. Code for America: 2025 Impact Report, "Built for This"
Visit site ↗What works: It leads with two numbers anyone can repeat, 7 million people helped and $22 billion in benefits delivered, beside a map of the 27 states plus Washington, D.C. where the team worked. A dated timeline of the year's federal changes comes before the highlights, so the results read in context, and a jump menu takes each funder straight to their program.
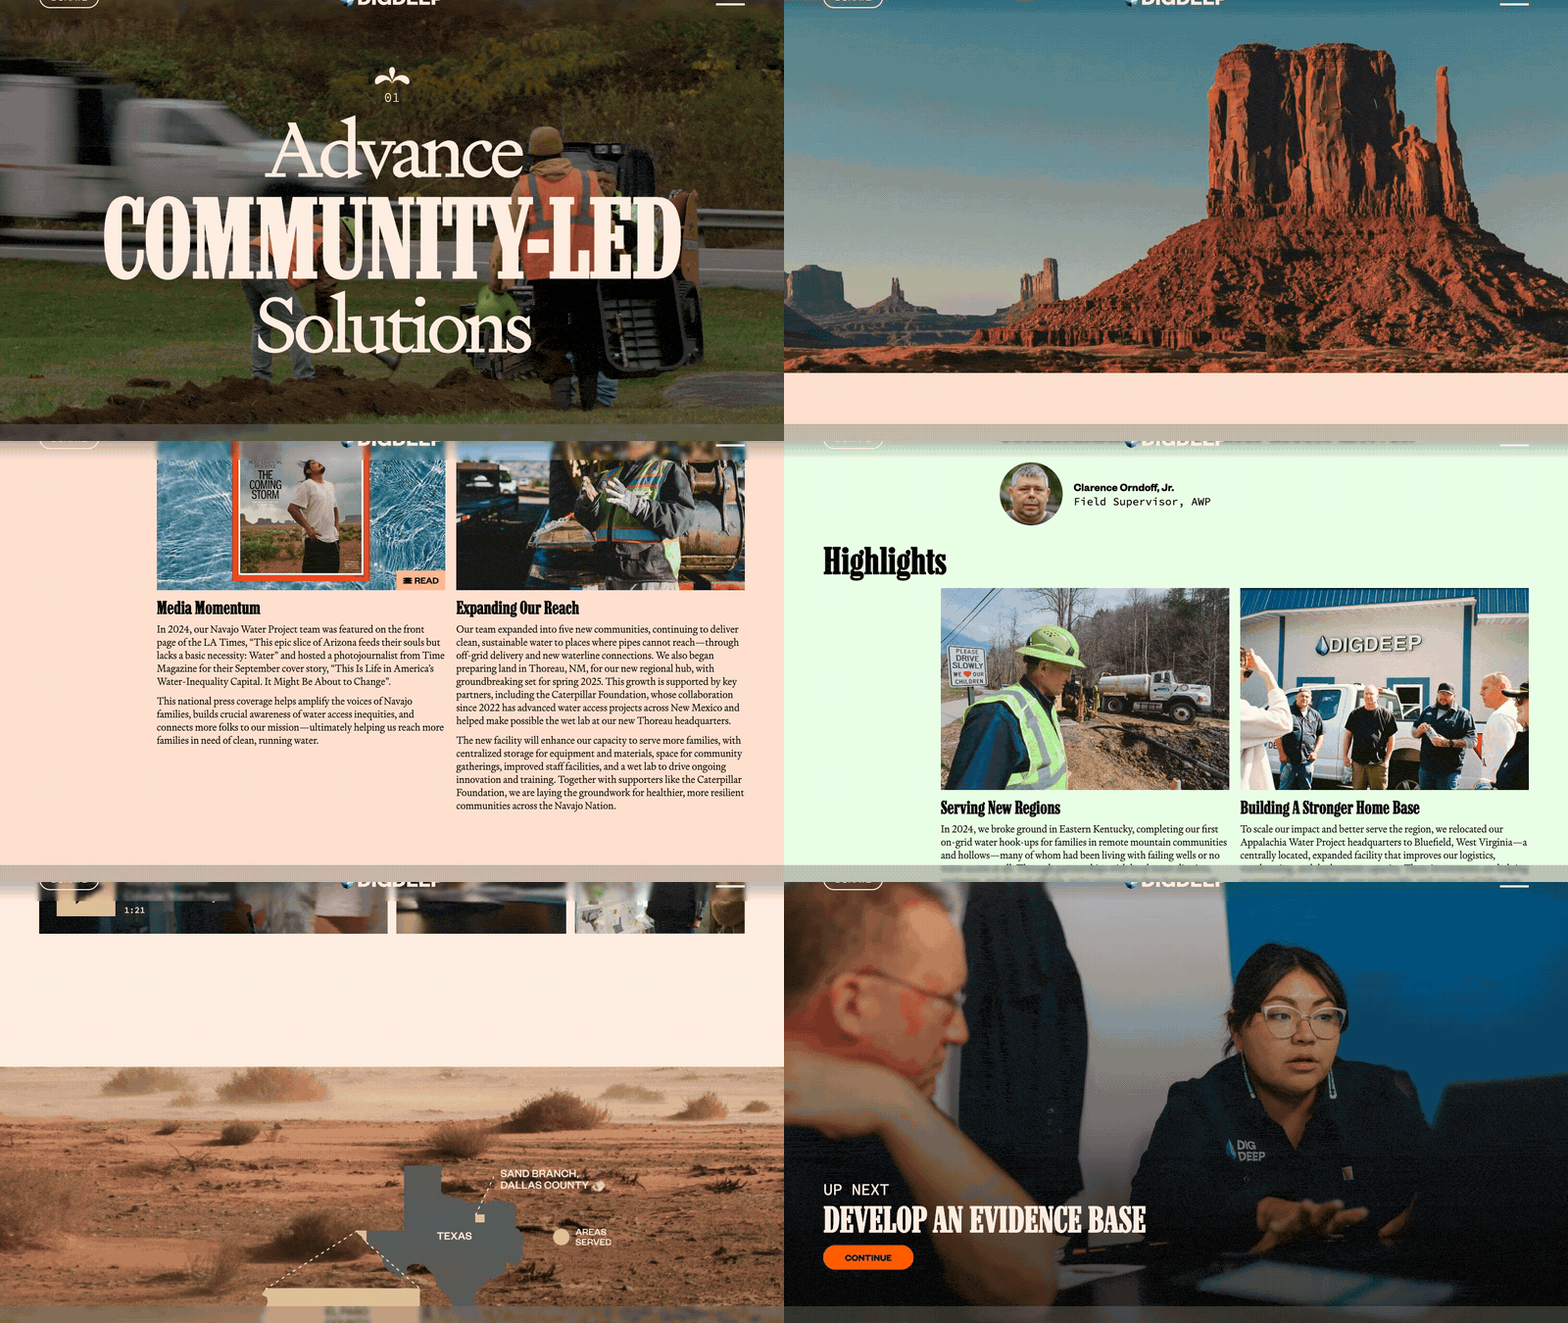
3. DigDeep: 2024 Annual Report
Visit site ↗What works: Six numbered chapters linked by "Up next" buttons, so it reads as a sequence rather than a menu. Each water project gets its coordinates, three numbers, a short film and an audio clip of a resident describing their journey to water access; the CEO letter has a play button too. Financials get their own chapter, with three years of budget growth.

4. World Vision International: 2024 Annual Report
Visit site ↗What works: After the opening line it tells readers what is coming: the work, the ENOUGH campaign, emergency response, the financial overview. Then every result gets a full sentence ("3.1 million people gained access to clean water, including: 1,181 schools serving 480,730 children, and 387 healthcare facilities"), so no number is left for the reader to interpret.
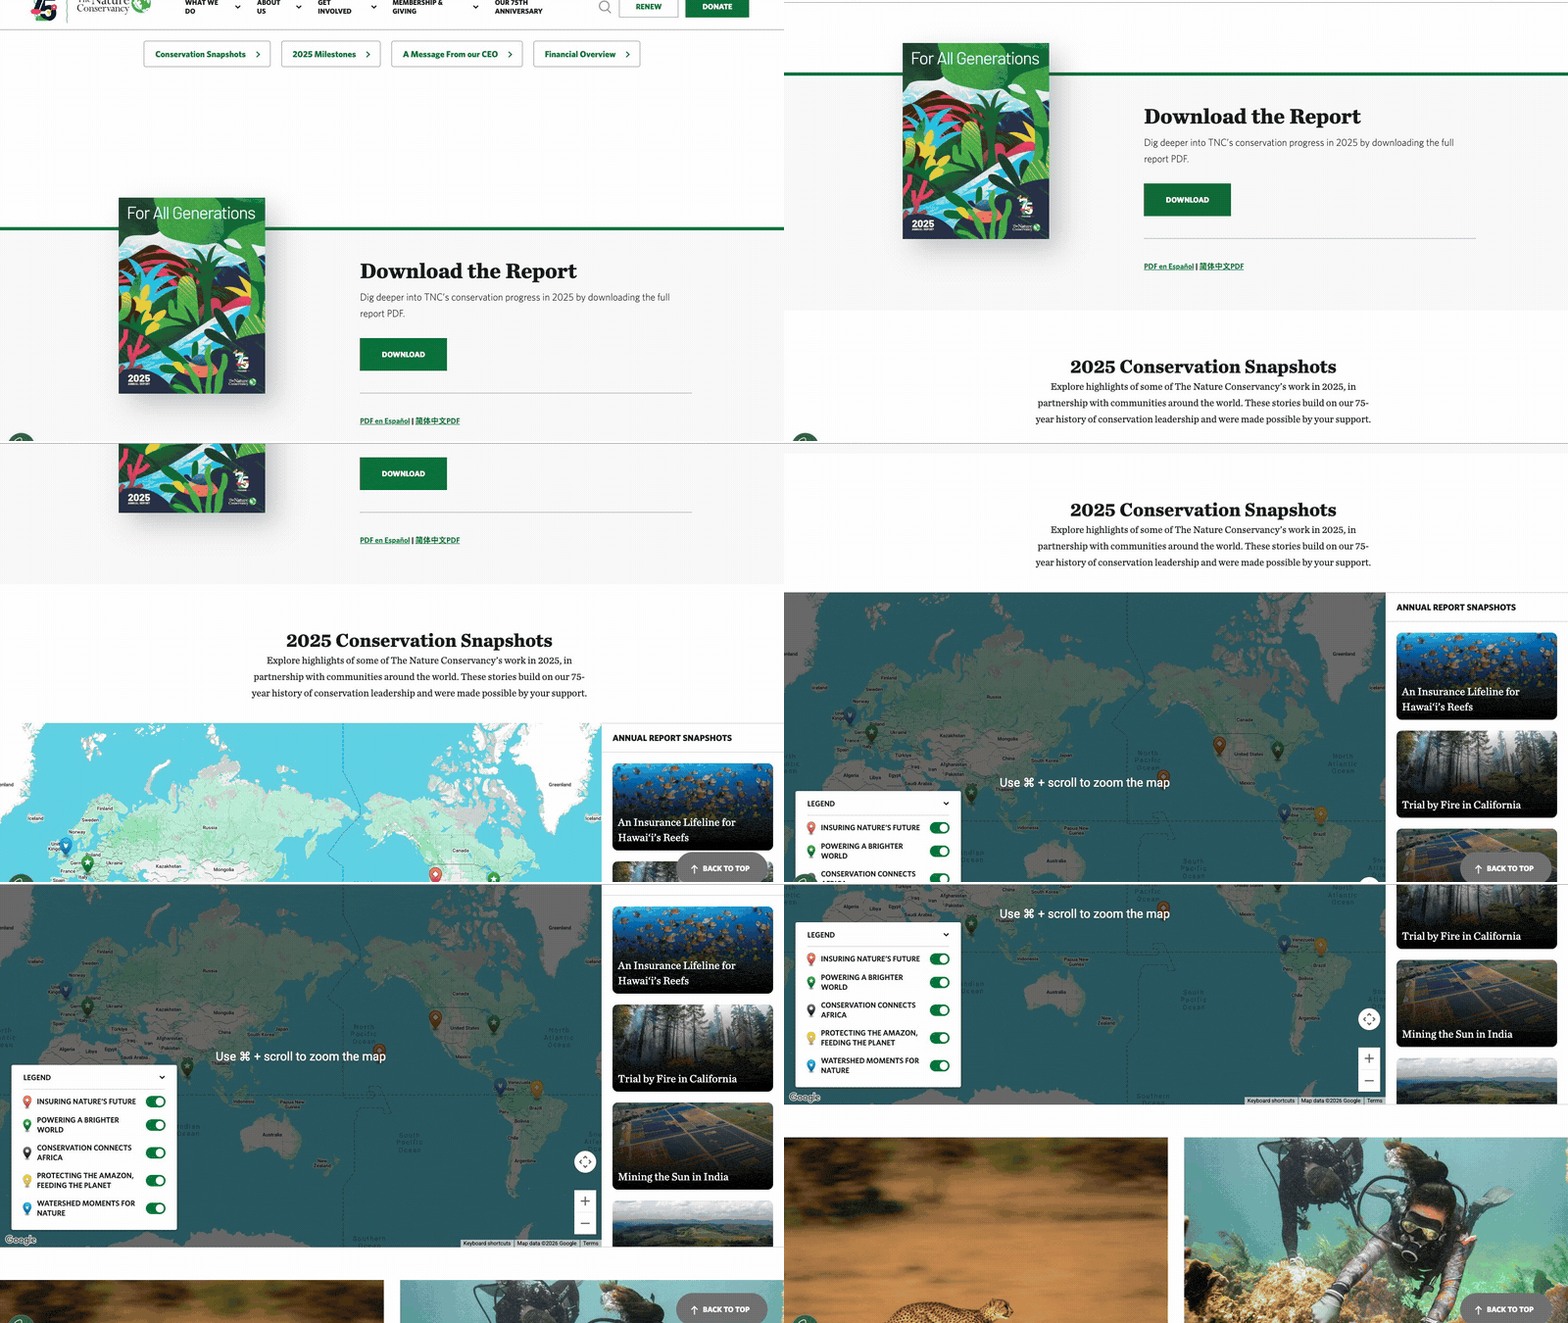
5. The Nature Conservancy: 2025 Global Annual Report, "For All Generations"
Visit site ↗What works: Ten "conservation snapshots" sit on a map with a filterable legend, so a reader in Zambia or Hawai'i finds their project first. The CEO and CFO letters stay folded until opened, the financials are real HTML tables with 2024 beside 2025, and the full PDF comes in English, Spanish and Simplified Chinese.
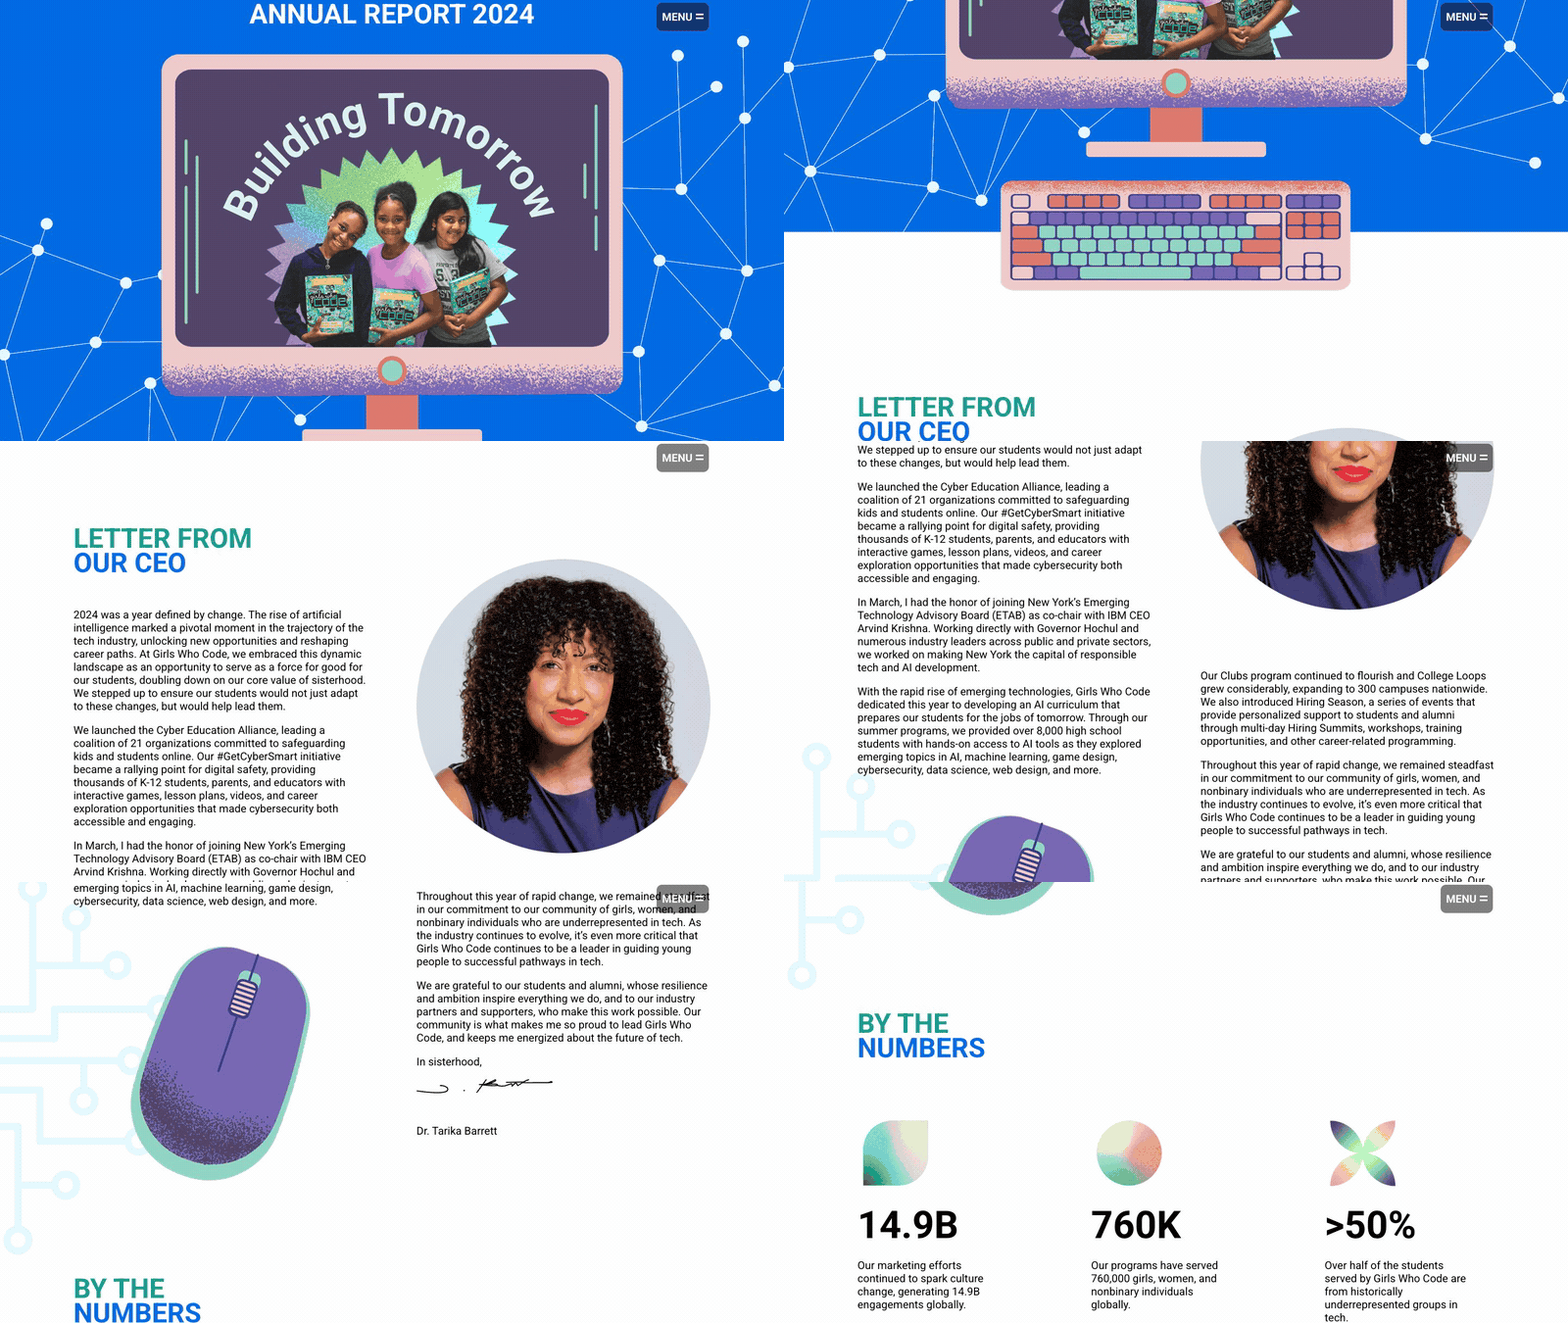
6. Girls Who Code: Annual Report 2024, "Building Tomorrow"
Visit site ↗What works: One page with an anchor menu: a "By the Numbers" block, then a year-by-year count of participants since 2012 that shows growth without a chart. The full statement of activities and financial position sits on the page as text, 2024 beside 2023, with a "Download PDF Version" button for anyone who needs the file.
Foundation impact report examples
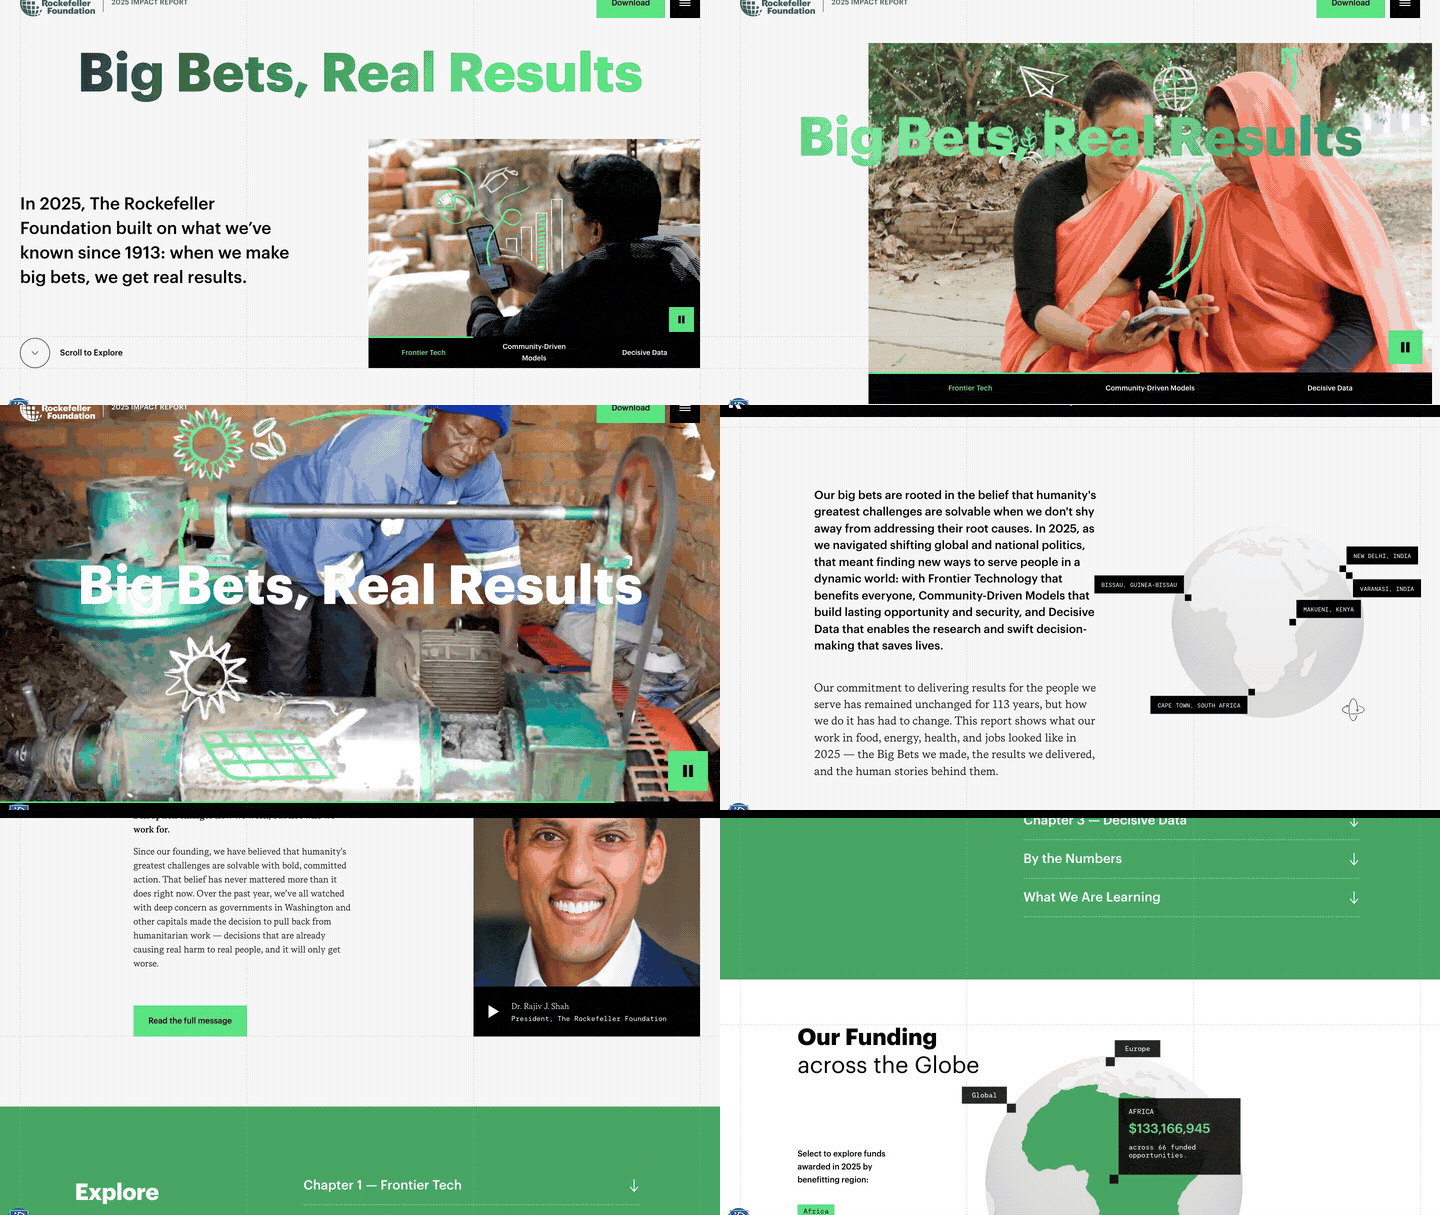
7. The Rockefeller Foundation: 2025 Impact Report, "Big Bets, Real Results"
Visit site ↗What works: Funding sits on a globe: pick a region to see the dollars and the number of funding opportunities there (Africa: $133,166,945 across 66). Results are grouped into people, planet and capital, a "What We Are Learning" carousel sets out six lessons rather than only wins, and "Curate Your Journey" filters the stories by issue.
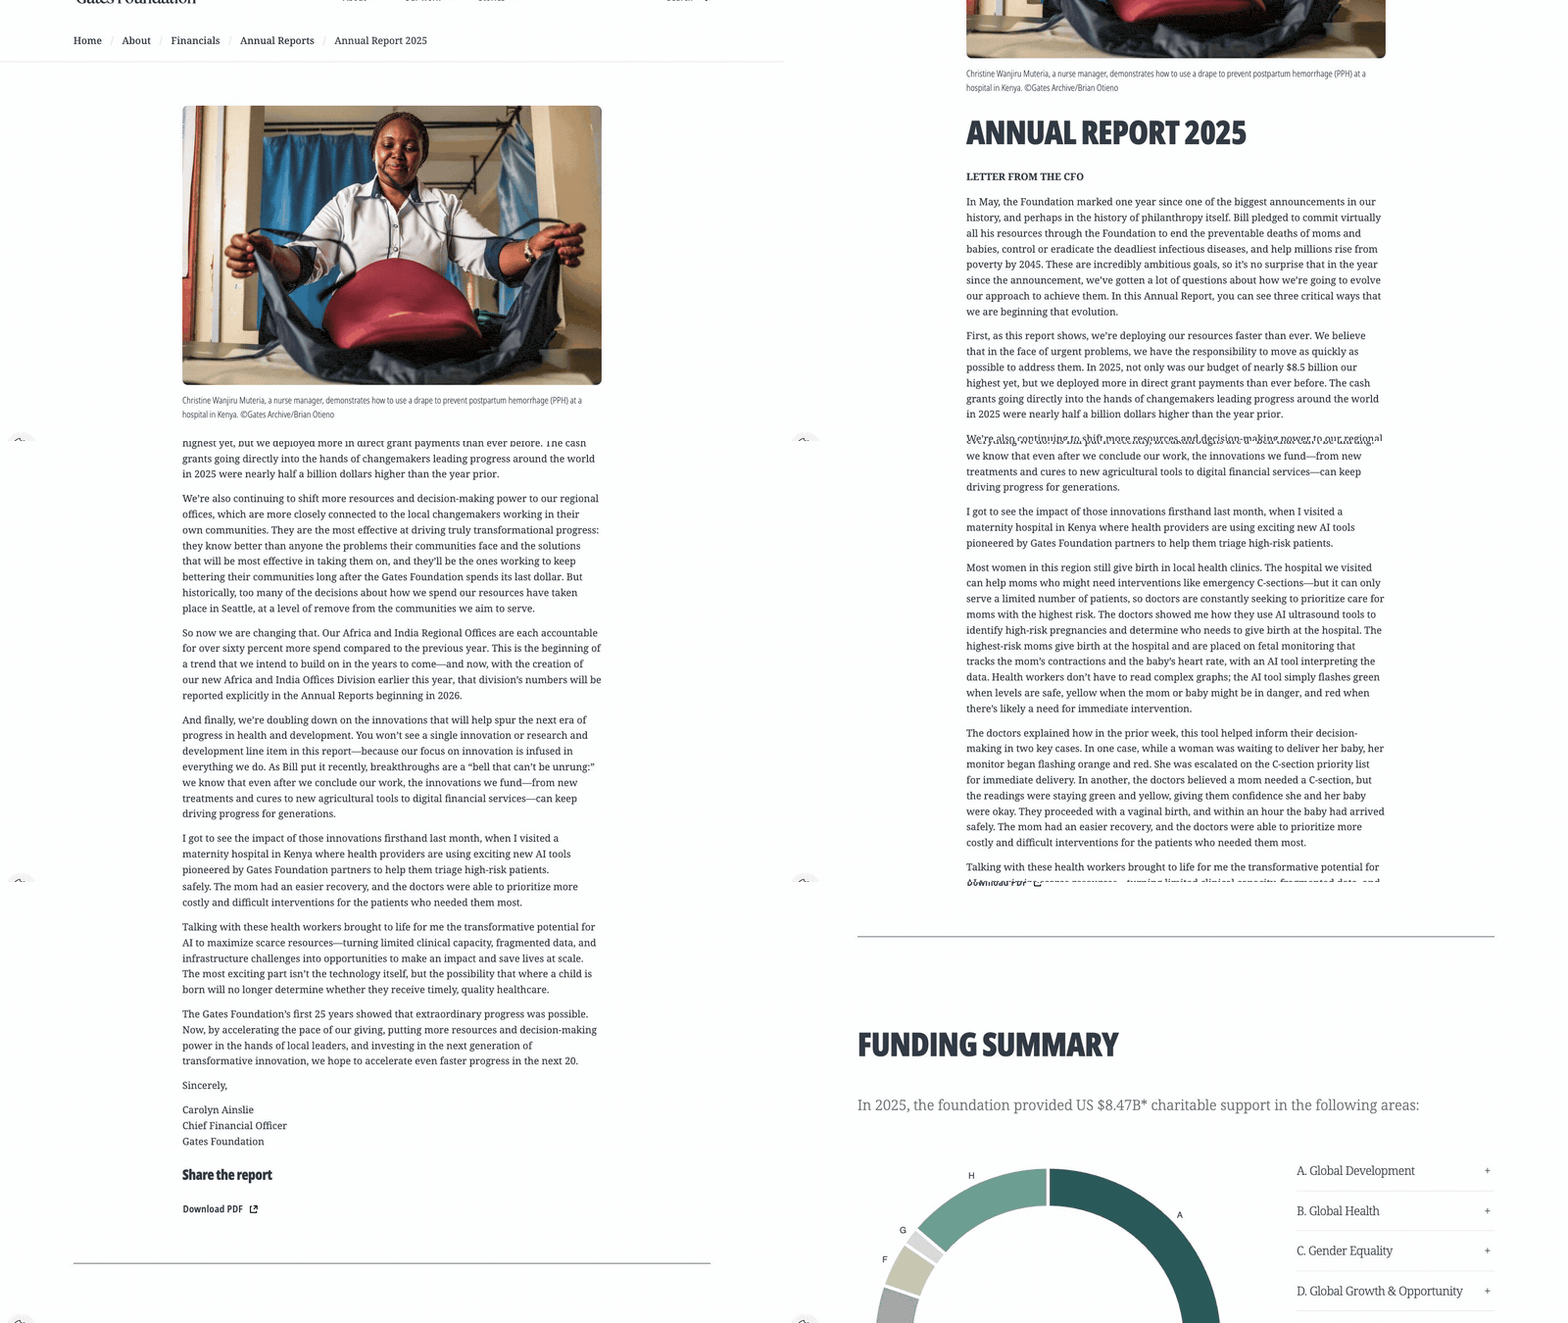
8. Gates Foundation: Annual Report 2025
Visit site ↗What works: A money page, done plainly. Total charitable support of $8.47B splits into eight lettered cards that each link to the work they paid for, then into tables down to single programs (polio: $749,000,000). A footnote says what the totals include and exclude, and the CFO's letter grounds the numbers in one scene at a maternity hospital in Kenya.
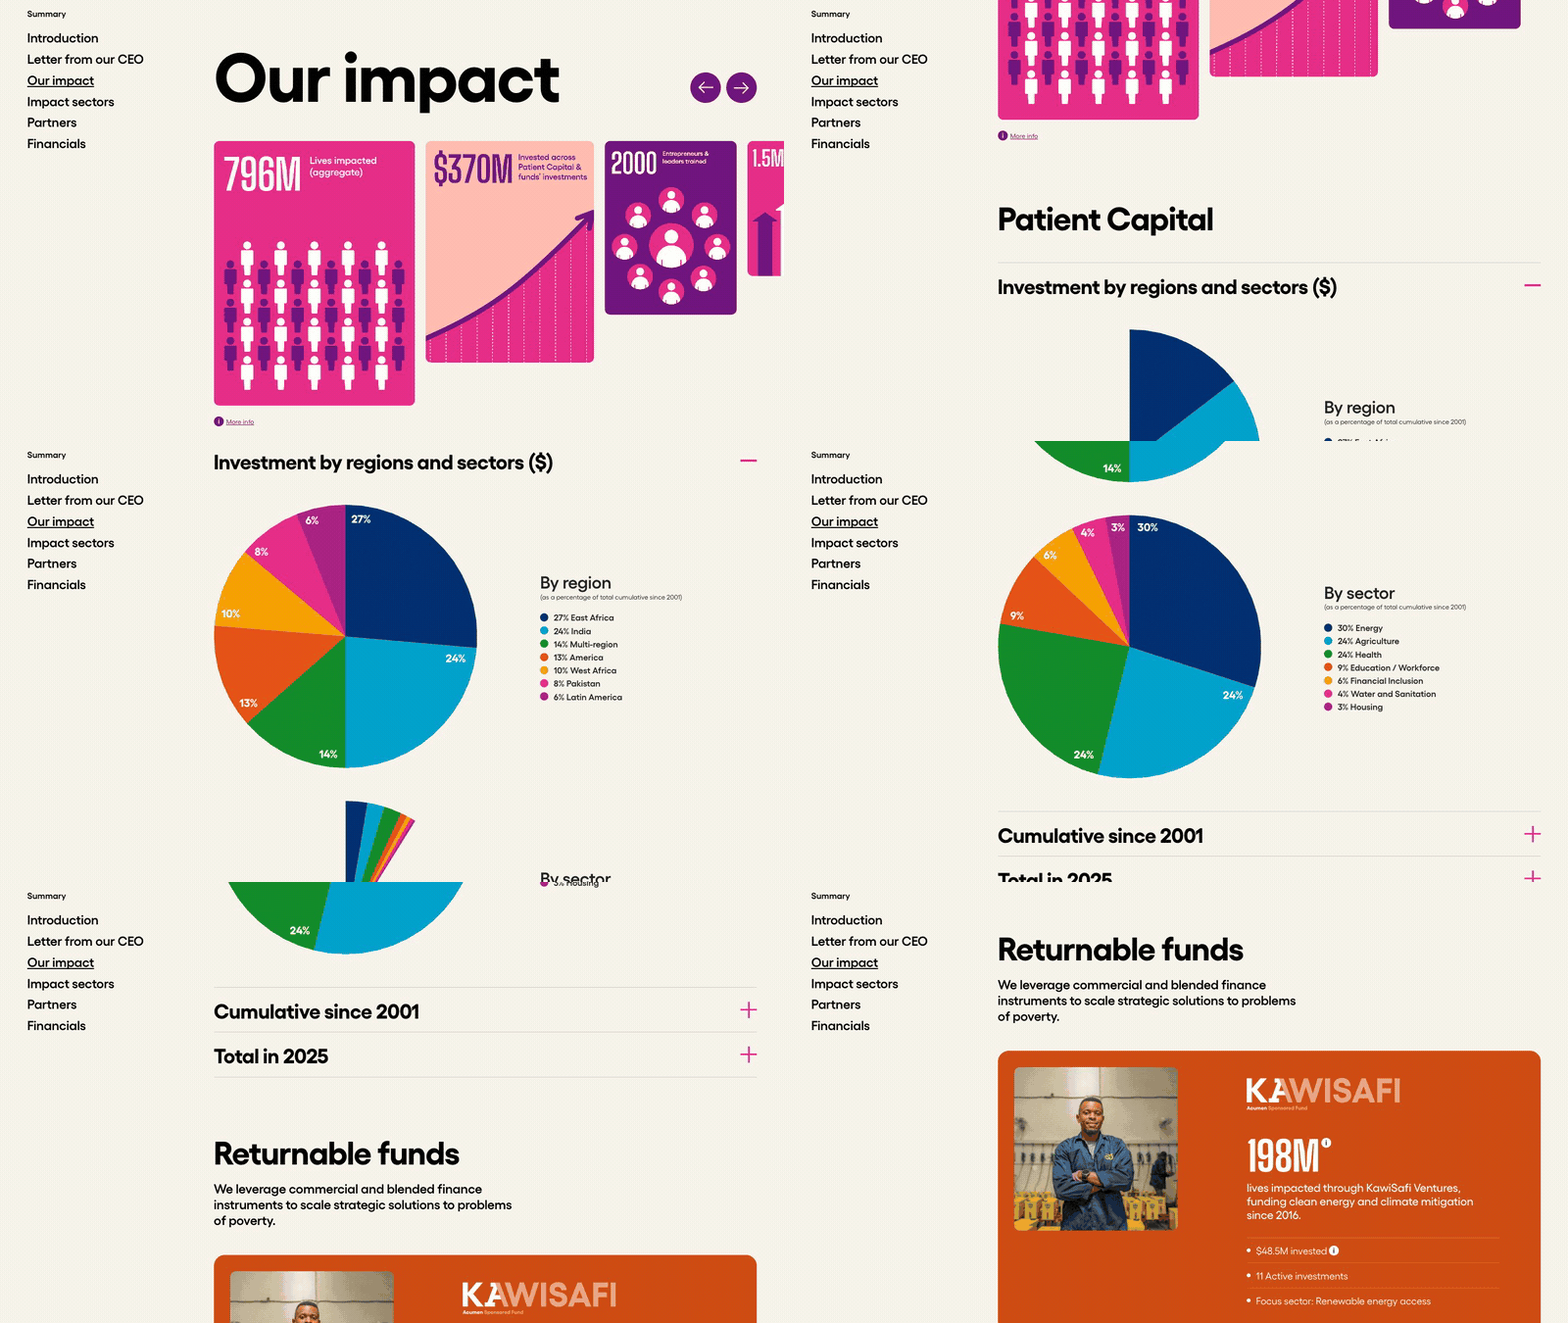
9. Acumen: 2025 Annual Report, "The Acumen Effect"
Visit site ↗What works: Counters roll up to the cumulative and 2025 totals, patient capital is broken down by region and by sector in plain percentages, and each impact area names the companies behind the numbers. The financials say openly that they are preliminary and unaudited, which costs nothing and buys trust.
University impact report examples

10. The University of Queensland: Donor Impact Report 2025, "Creating Change"
Visit site ↗What works: Short on purpose: a thank-you letter from the Vice-Chancellor, $95.2M raised with a chart, and four numbers. The donor count is split into alumni, staff and first-time donors (2,325, 831 and 1,789), so each reader sees where they fit. A thank-you report, sized like a thank-you note.

11. University of Washington: 2025 Gratitude Report
Visit site ↗What works: Each of three stories is introduced by a number (9,192 students, 272 research centers and institutes, 126 new endowments), then the person or project behind it. A gifts-by-purpose table separates current use from endowment, and a list of 24 schools and units, each with donors and dollars, lets every dean and donor find their line.
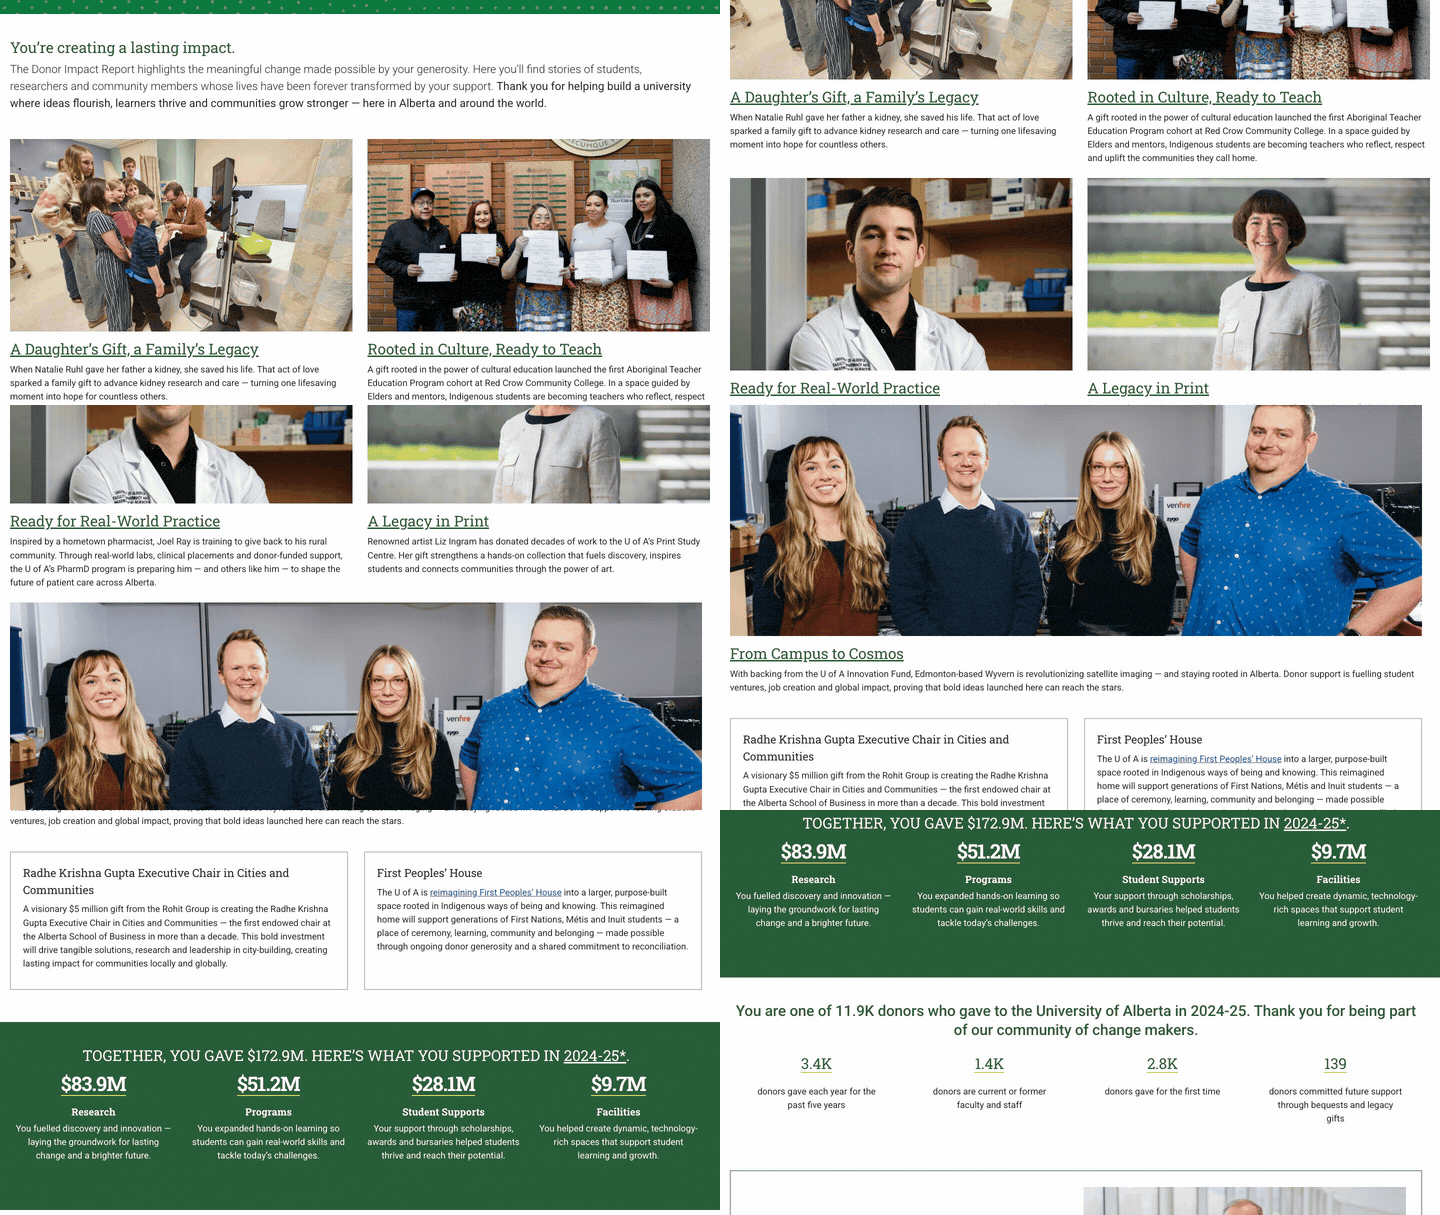
12. University of Alberta: Donor Impact Report 2025
Visit site ↗What works: Written to the reader throughout, from "You're creating a lasting impact" to "Together, you gave $172.9M". Donor statistics include loyalty and legacy (3.4K donors gave every year for the past five years; 139 committed future gifts), and the page ends by asking whether the report was useful, with Yes, No and Not sure buttons.
Corporate ESG and impact report examples
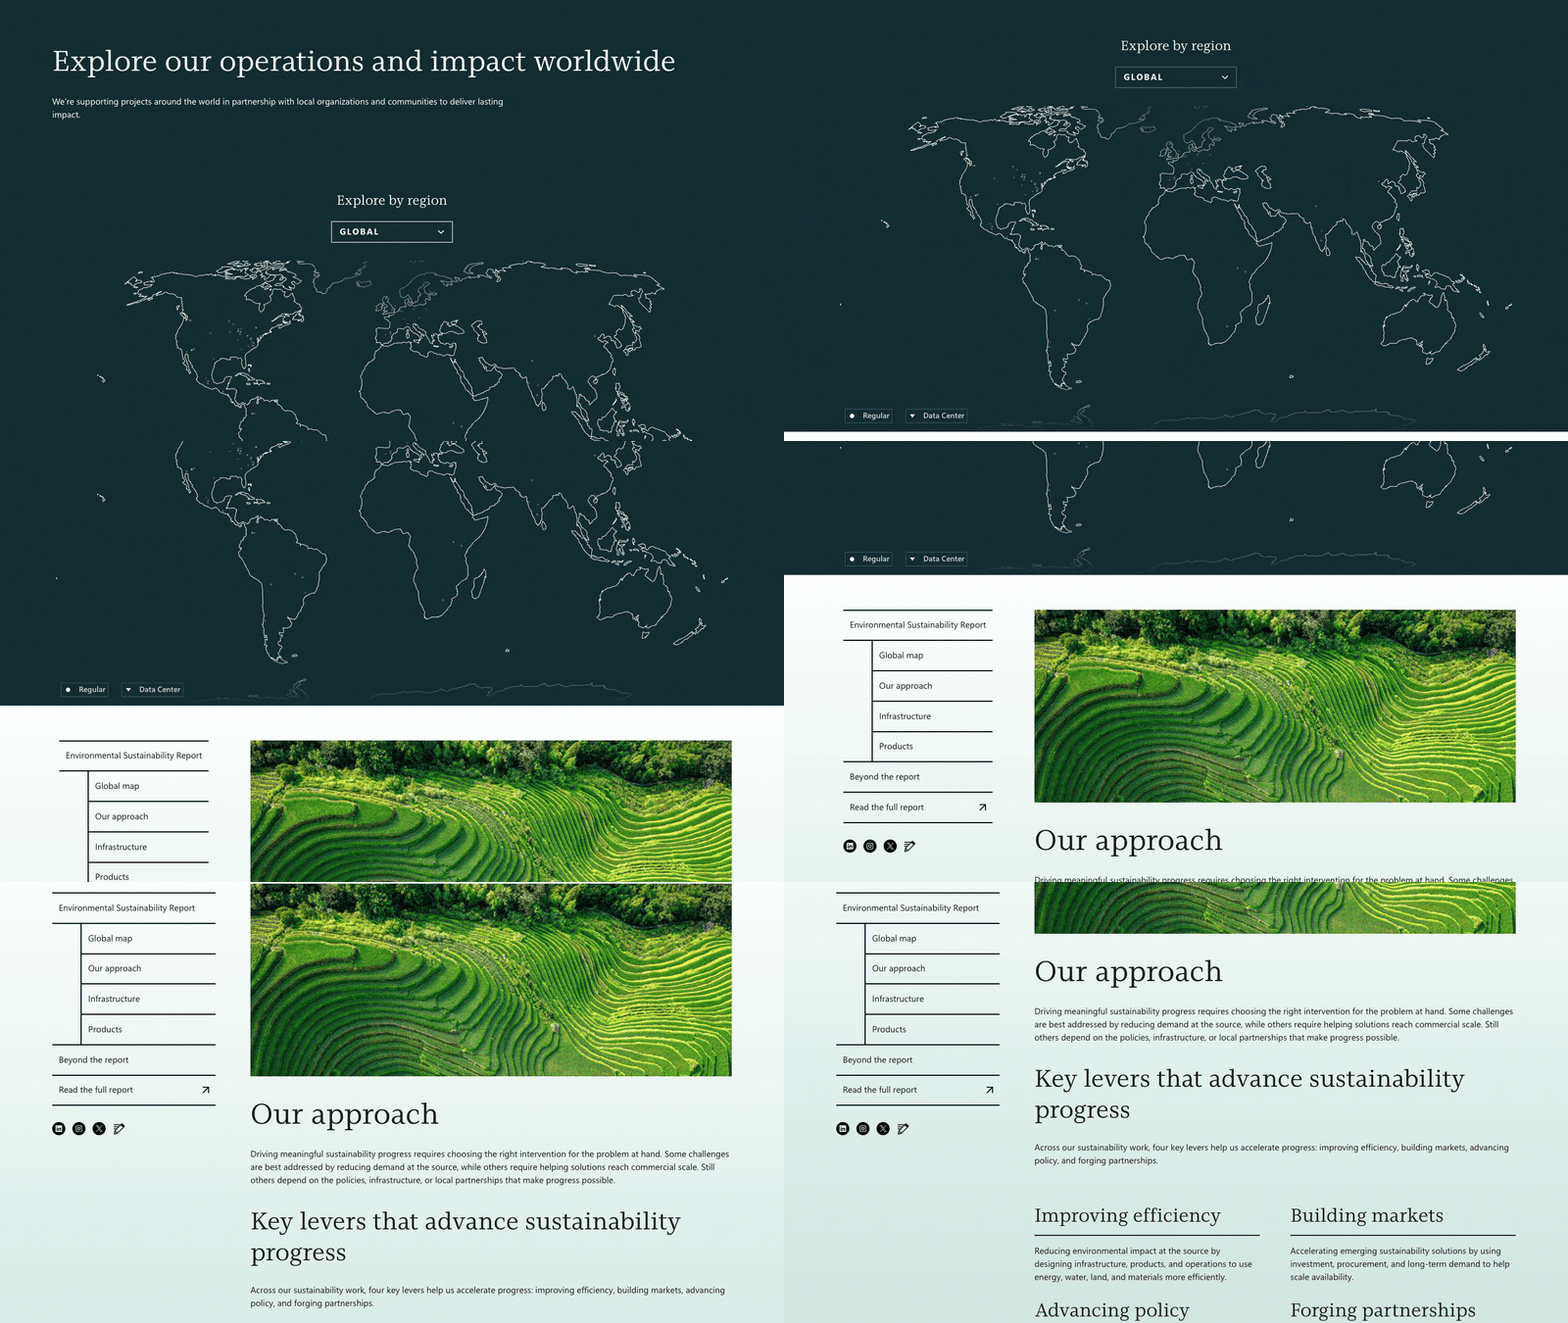
13. Microsoft: 2026 Environmental Sustainability Report
Visit site ↗What works: The web version, covering fiscal 2025, leads with a world map: filter by region, toggle to datacenter sites, and read project stories tagged carbon, water, waste or ecosystems. Headline results are full sentences with the year in them ("In FY25, we replenished over 14.2 million m³ of water"), and analysts get the full PDF and a separate data fact sheet.
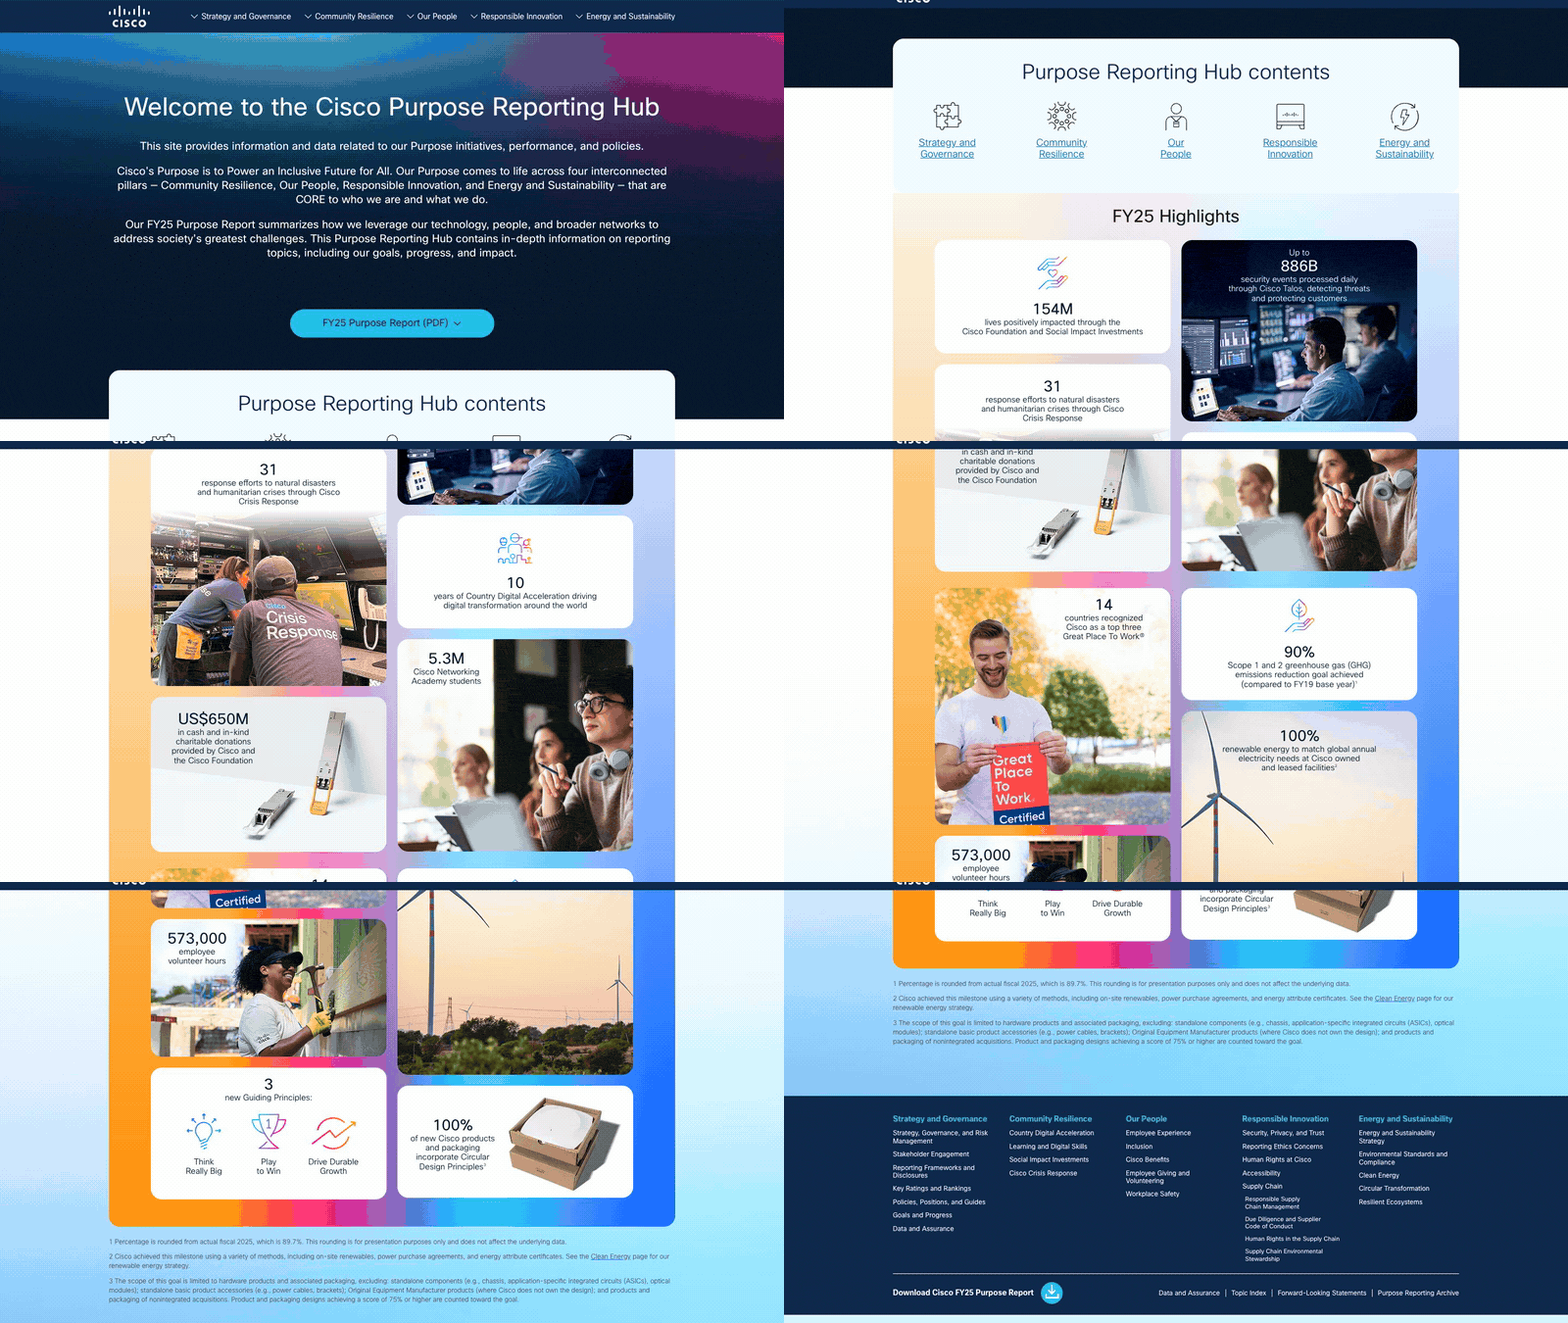
14. Cisco: FY25 Purpose Reporting Hub
Visit site ↗What works: Cisco splits the job. The designed report is a PDF in nine languages; the web hub holds what ESG analysts look up: GRI, SASB and TCFD pages, data and assurance, a topic index and an archive. The footnotes are honest: a 90% emissions-reduction goal is marked achieved, and the footnote gives the actual figure, 89.7%.
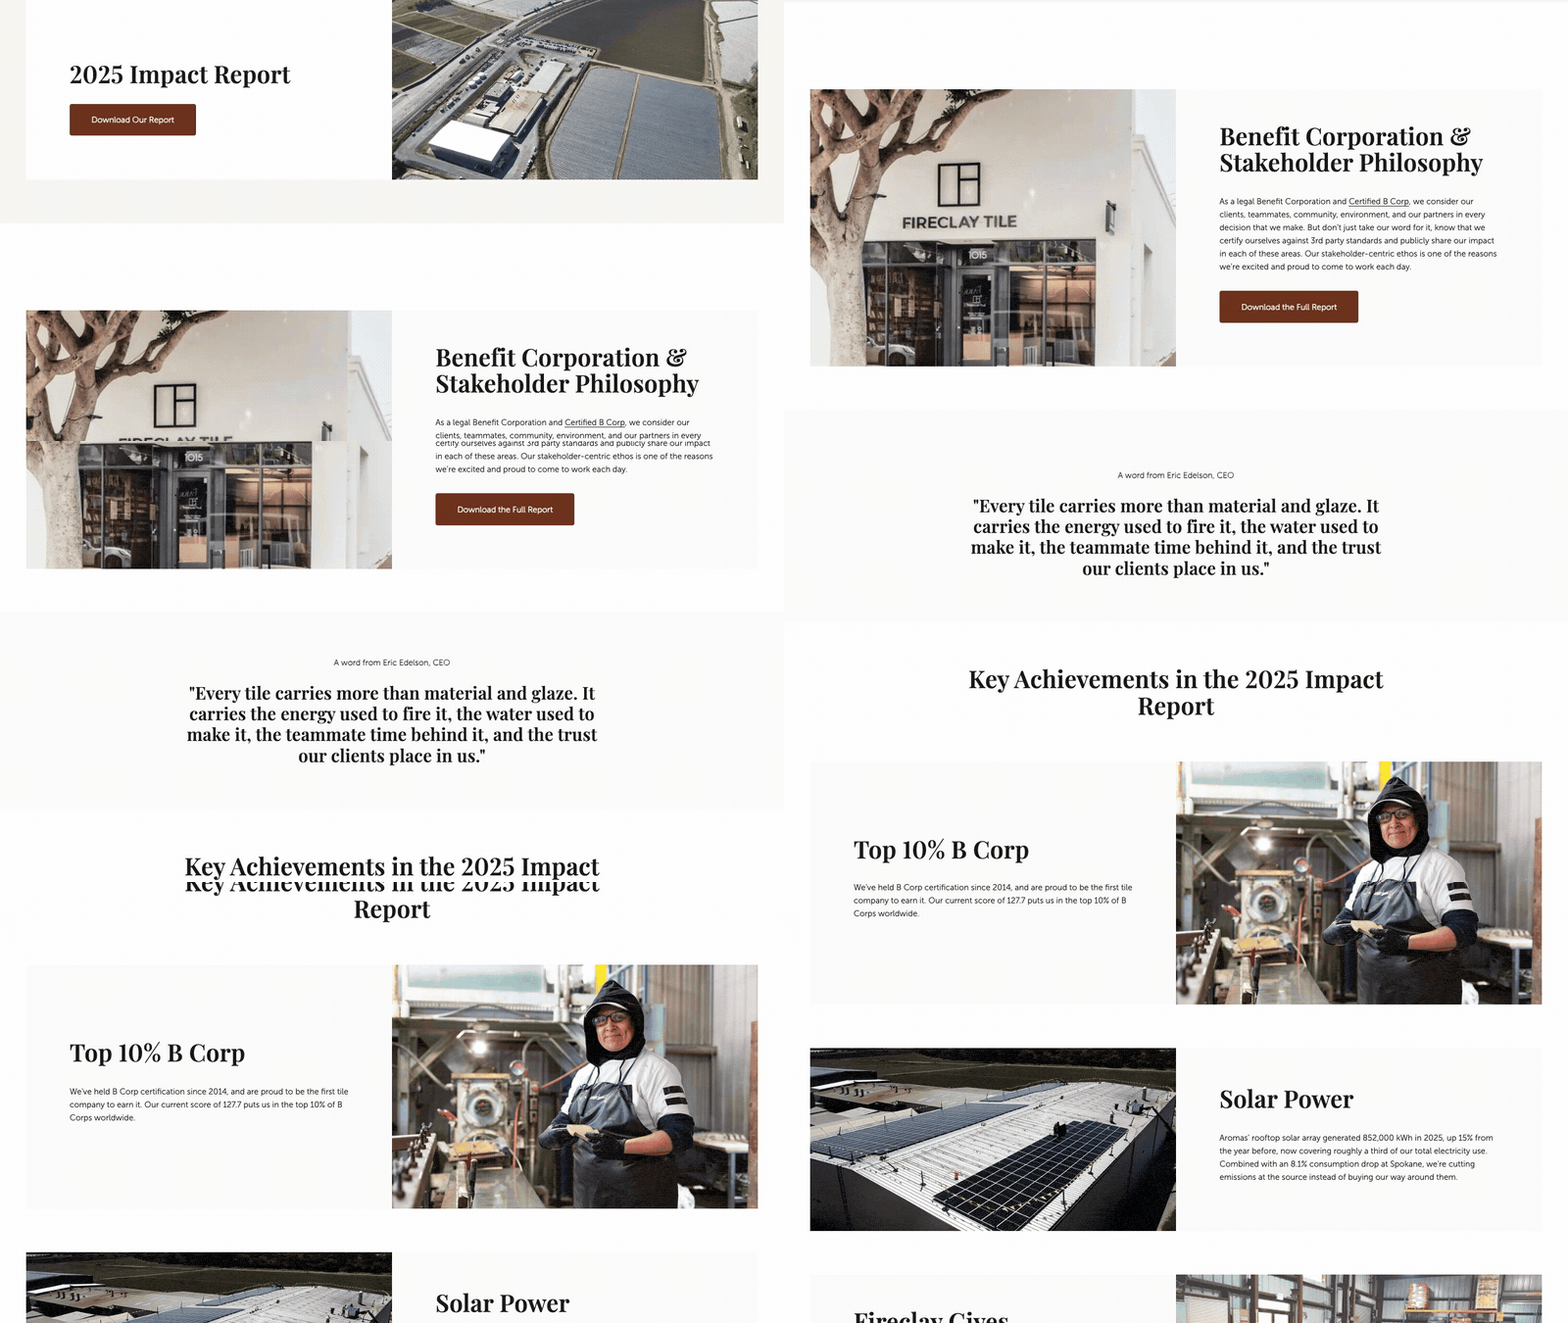
15. Fireclay Tile: 2025 Impact Report, "Made for Good"
Visit site ↗What works: A small manufacturer's version: a web page that does the PDF's job for most visitors. Five results, each a number plus what it means (freshwater use down 58.4%; a safety rating improved from 166 to 81 in a year), a CEO quote, a B Impact score of 127.7, and every report since 2020 linked from the same page.
Patterns that work
Read the 15 side by side and the same moves keep coming back. None of them needs a big budget.
Numbers with a sentence attached
Counters that roll up, as on Acumen's report, get attention. What earns trust is the sentence next to the number: World Vision, the University of Washington and Microsoft never leave a figure on its own. Two or three numbers a reader could repeat, as Code for America leads with, beat a wall of twenty. In Scrollytelling, the chart widget draws bar, line and pie charts as the reader arrives.
One person, one place, one story
Wikimedia tells its year through one article. DigDeep lets residents tell their own story in audio. The University of Washington puts a student or a lab behind every number. One specific story makes the totals believable, and the totals make the story matter.
Chapters, and a way to skip
DigDeep links its chapters with "Up next". Code for America and Wikimedia put a jump menu at the top, Rockefeller filters by issue, and The Nature Conservancy folds its letters until opened. Board members, funders and journalists each want a different section; let them get there.
Show where the work happened
Rockefeller's globe, The Nature Conservancy's snapshots, Microsoft's region filter, Code for America's states, Wikimedia's volunteer stories: a map answers "is any of this near me?" faster than a list of countries. See the interactive map widget.
Money as text, not a picture of a table
Gates, Wikimedia, Girls Who Code and The Nature Conservancy put their financials on the page as text. They can be searched, read aloud by a screen reader and corrected after publication.
Admit something, then invite
Rockefeller's "What We Are Learning", Acumen's "preliminary, unaudited" label and Cisco's rounding footnote read as confident, not weak. Then end on one next step: donate (DigDeep), subscribe (Rockefeller, The Nature Conservancy) or tell us if this was useful (Alberta). The last screen is where readers decide.
PDF vs digital: what readers finish
Nobody can tell you what share of readers finish a PDF impact report, because a PDF cannot tell you. The UK Government Digital Service said so in 2018: it could count downloads but "cannot get data about how users have interacted with a PDF" (Neil Williams, "Why GOV.UK content should be published in HTML and not PDF", GDS blog, July 16, 2018). A web report can show how far readers scroll in each section, which is the number that tells you whether anyone reached the financials.
The usability research points the same way. Nielsen Norman Group's 2020 review found that users "often struggle to stay oriented" in PDFs and concluded that "Burying information in PDFs means that most people won't read it" (Jakob Nielsen and Anna Kaley, "PDF: Still Unfit for Human Consumption, 20 Years Later", August 9, 2020). On a phone, a PDF means pinching and zooming a page laid out for paper.
That does not make the PDF useless. Auditors, grant officers, board packs and archives still want a fixed file. What the 15 examples do is put the web page first and the PDF second. By our count in November 2026, 9 of them link a full PDF from the page; Code for America, DigDeep, Acumen, Queensland and Alberta publish no PDF of the report itself (DigDeep links its audited financials), and Rockefeller offers a short PDF snapshot instead. That matches the Nielsen Norman Group recommendation: a web page that carries the key points, with the PDF as an optional download.
| Question | PDF report | Web report |
|---|---|---|
| Reading on a phone | Pinch, zoom, scroll sideways | Text reflows to the screen |
| What you can measure | Downloads | Visits, scroll depth by section, clicks |
| Fixing a number after launch | Re-export and re-upload | Edit and republish at the same URL |
| Sharing one section | "See page 14" | A link to the section |
| Accessibility | Only if the file is properly tagged | Headings, alt text and tables are native to HTML |
| Print and archive | Yes, this is what it is for | Keep the PDF for this |
For the vendor side of this decision, see our interactive annual report software comparison.
Make yours from your PDF
Most teams reading this already have the report as a designed PDF. You do not need to start again.
- Upload the PDF. The annual report maker reads your PDF (or a Word file, a text file or a URL) and drafts a designed scroll story from it: sections, a leadership message, headline numbers that count up as readers scroll, and charts.
- Check and edit everything. Every word, number, image and color is editable. Read the draft against your source, as you would any first draft. Add the pieces the examples above use: a chart, an interactive map, a timeline, a carousel of stories, an FAQ.
- Publish and share. Publish to a link, or to your own domain on Pro, embed it in WordPress, or download it as a self-contained ZIP on any plan. Keep the full PDF for the record and link it from the report.
Here is a short demo report built that way, embedded live. Scroll inside the frame.
Writing a nonprofit report? Our nonprofit annual report guide covers structure and donor sections. For company, nonprofit and internal variants side by side, see annual report examples, and for what goes in each section, what to include in an annual report.
Frequently asked questions
What should an impact report include?
A short letter from leadership, the two or three results that matter most with their baselines, at least one story of a person or place, where the money came from and where it went, what you learned or what did not work, and what comes next with one way to act on it. If you report on grants, add a short note on how you measured results.
How long should an impact report be?
As long as the evidence needs and no longer. The examples above range from the University of Queensland's few screens to Wikimedia's long report with chapters. What matters more than length is that the first screen works on its own and that readers can jump to the section they came for.
Digital or PDF impact report?
Both, with the web page first. A web report reads properly on a phone, can be shared by section, corrected after launch and measured by scroll depth; a PDF can only be counted as a download. Keep the PDF for auditors, board packs and archives, and link it from the web report.
How do I make an interactive impact report for free?
Upload your report PDF to the Scrollytelling annual report maker. It drafts an interactive scroll story you can edit, and the Free plan builds stories and publishes one on a scrollytelling.ai link. Downloads as a self-contained ZIP work on every plan. Pro, from $12/month with every feature and cancel any time, adds more published stories and a custom domain.
Turn your report PDF into a web report
Upload the PDF you already have and get an interactive version you can edit, publish and share. Free to start. Pro from $12/month, cancel any time.
Upload your report PDF → Browse annual report templates →