What interactive annual report software actually has to do
Separate three artefacts that get lumped together as "the annual report", because no single tool does all three well.
The statutory filing. An issuer covered by the EU Transparency Directive publishes its annual financial report in XHTML with Inline XBRL tagging on the consolidated IFRS statements under the European Single Electronic Format rules. A US domestic registrant files a Form 10-K with the SEC. That is compliance work with its own specialist tooling, and no interactive-content platform replaces it.
The narrative report. The version you send to staff, donors, customers and the shareholders who will never open a 10-K. This is what the category is for.
The archive copy. A fixed document for a board pack, an auditor, or a seven-year file.
With that line drawn, the job spec gets specific. The software has to turn a fixed set of numbers, a leadership message, some milestones and some photography into a page a non-specialist will scroll to the end of on a phone, that can be corrected after publication, that assistive technology can read, and that still resolves at the same URL in five years when somebody cites it. Everything else is preference.

The five categories of option
1. Design and layout tools
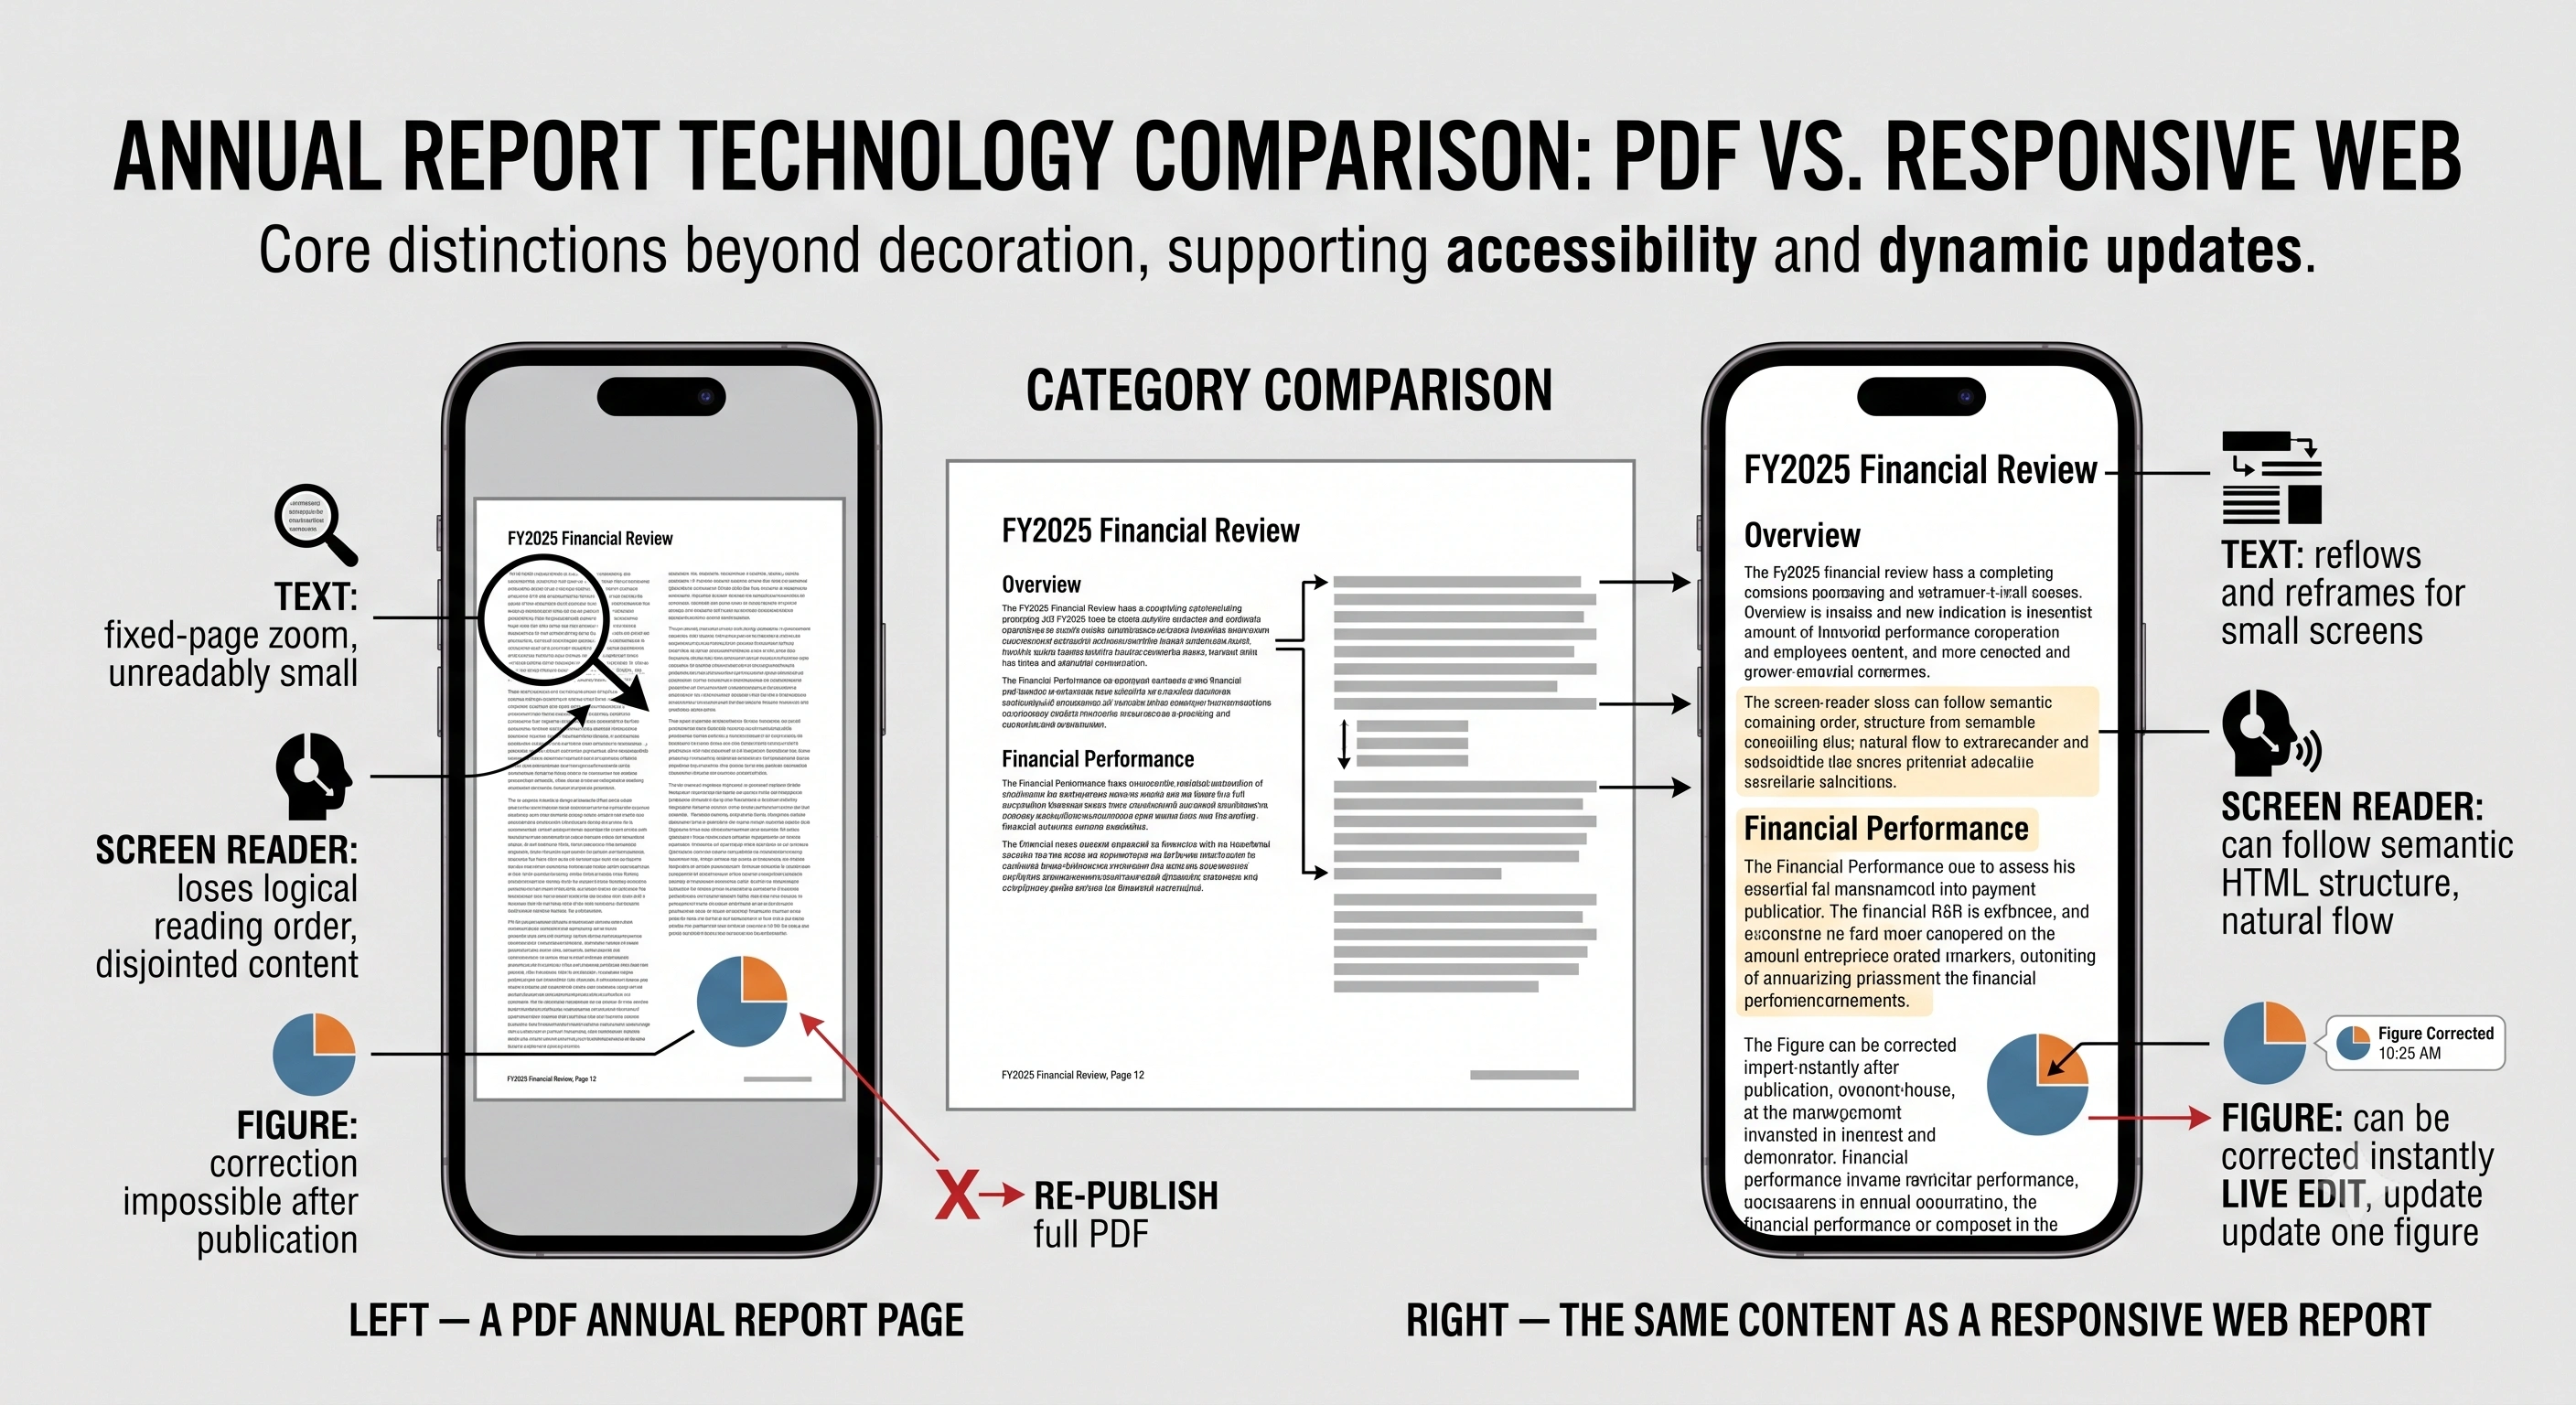
InDesign, Canva, Figma, Affinity Publisher. The incumbent, because annual reports have historically been print artefacts. Total typographic control, and the output is a file. Adobe's Publish Online and Canva's share links will put that file on the web, but what arrives is a page-shaped rendering of a print document: fixed columns, text baked into images, reflow ranging from awkward to absent.
2. Digital publishing and interactive content platforms
Foleon, Ceros, Maglr, Turtl, Shorthand, Genially, Visme. The category that markets itself directly at annual reports. Output is web-native, responsive and hosted, usually with analytics and CRM integrations attached. The trade-off is commercial: as of August 2026 Foleon lists four plan tiers — Grow, Scale, Team and Enterprise — each carrying a "request a quote" button and no number, and Ceros publishes no figures either, offering a free Starter tier and routing Growth and Enterprise to sales. Shorthand is the transparent outlier: its published pricing shows Starter at $60/month billed yearly with 12 published stories a year, Team at $875/month and Business at $1,750/month, extra stories charged per publication.
3. PDF-to-flipbook converters
Issuu, FlippingBook, Publuu and a long tail of similar services. They wrap the PDF you already have in a page-turn viewer with a share link and embed code — the fastest route from a finished print file to something that lives at a URL. Be clear-eyed about what you are buying: on a phone the reading experience is a zoomable page image, text is often not usefully selectable, and accessibility inherits every weakness of the source PDF. "Interactive" here means the page turns.
4. Custom development builds
A designer and a front-end developer building the report as a real web page — Webflow, Next.js, Astro — with scroll behaviour from GSAP, Scrollama, or increasingly native CSS scroll-driven animations. The ceiling: anything you can draw, you can build, and you own the output. Also the highest cost, the longest calendar, and the option most likely to become unmaintainable the year the developer leaves. See scroll-driven storytelling for the technique and agency versus in-house for the cost side.
5. AI-first story builders
The newest category, ours included. You supply the year's numbers and highlights, the tool drafts structure, copy and visuals, and you edit from there. The first complete draft exists in minutes rather than weeks. The honest limitation: you work within a system's layout vocabulary rather than drawing freely, and generated copy always needs a factual pass before it goes near a shareholder.
Category comparison
Click a column header to sort. Pricing reflects what each vendor's own pages showed as of August 2026 and changes often.
| Category | Typical products | What you get | Pricing model (Aug 2026) | Mobile reading | You can export it | Best when |
|---|---|---|---|---|---|---|
| Design tools | InDesign, Canva, Figma | A designed file, optionally hosted | Seat-based subscription | Page-shaped, limited reflow | Yes — it is a file | The print or archive copy is the priority |
| Publishing platforms | Foleon, Ceros, Shorthand, Maglr | Hosted responsive web publication | Mostly quote-based; Shorthand publishes rates | Genuinely responsive | Plan-dependent — Shorthand offers ZIP download and self-hosting on some plans | You publish several reports a year and have budget |
| Flipbook converters | Issuu, FlippingBook, Publuu | Your PDF in a page-turn viewer | Low monthly tiers, often with a free plan | Zoom-and-pan page images | The source PDF is yours | You already have a designed PDF and need a link |
| Custom build | Webflow, Next.js, GSAP, Scrollama | A bespoke web page you own | Project fee plus hosting | As good as you build it | Yes — it is your code | The report is a flagship brand moment |
| AI-first builders | Scrollytelling.ai | Generated draft, then a visual editor | Free tier; Pro $29/mo, Pro+ $59/mo | Responsive by default | Self-contained ZIP on Pro+ | Small team, fast turnaround, tight budget |
Disclosure: the highlighted row is ours. Everything in it is checkable on our annual report maker without paying.
Ten checks before you buy
Run every shortlisted tool through these, using last year's report as the test content.
1. Phone first, on a real connection
Open a vendor's showcase report on a mid-range phone with the network throttled. Watch multi-column tables, full-bleed heroes and wide charts, and time how long it takes to become readable. This eliminates more products than any feature list.
Ask: can I see three customer reports on mobile before we talk price?2. How the numbers get in — and corrected
Figures get restated after publication. Find out whether editing a live report is a click or a re-export, and whether charts are live objects or flat images someone must redraw.
Ask: show me changing one number in a published report, start to finish.3. Print and PDF parity
Almost everyone still needs a fixed document. Three answers are possible: the tool exports one from the same content, you maintain a separate layout in a design tool, or it is your problem. All three work. Only one is what people assume.
Ask: is the PDF generated from this content, or maintained separately?4. Accessibility, tested not claimed
Covered in detail below. "WCAG compliant" on a marketing page means nothing on its own. Ask which version and level, ask for the conformance report, then run a live example through a screen reader yourself.
Ask: which WCAG version and level, and can I see the conformance report?5. The URL, and who controls it
A report at vendor.com/yourcompany/2026 is a link you do not own. Leave the platform and it dies, taking every citation with it. Your own domain means you can redirect it later whatever happens to the vendor.
6. Export and ownership
Some platforms will only ever host the report for you. An export producing a self-contained folder of HTML, images and fonts is the difference between an archive and a rental.
Ask: can I download the built report as static files today?7. Drafts, embargo and sign-off
Report content is often price-sensitive until a board meeting, and approval is the real bottleneck. Check that drafts are not reachable at a guessable URL, that publication can be delayed or password-protected, and that comments and roles live in the tool rather than a parallel Word document.
Ask: is a draft reachable by anyone with the link, and what does a reviewer seat cost?8. Analytics you will actually use
Page views are close to useless here. Scroll depth by section tells you whether anyone reached the impact chapter, and it is the number that justifies doing this again next year.
Ask: can I see scroll depth per section, and install our own analytics?9. Brand fidelity
Template-driven tools vary wildly on typography: some accept a font file, some offer a dropdown of web fonts, some lock it entirely. Test with your real brand fonts in the trial, not with the demo content.
Ask: can I upload our licensed brand font?10. Cost per published report
Normalise everything to this one figure. A low monthly rate with a per-story publishing fee can beat a flat plan, or lose to it, once you add a sustainability report, a half-year update and three regional versions. Get it in writing whether a translated version counts as a new publication or a variant of an existing one.
Ask: what does our fourth report this year cost?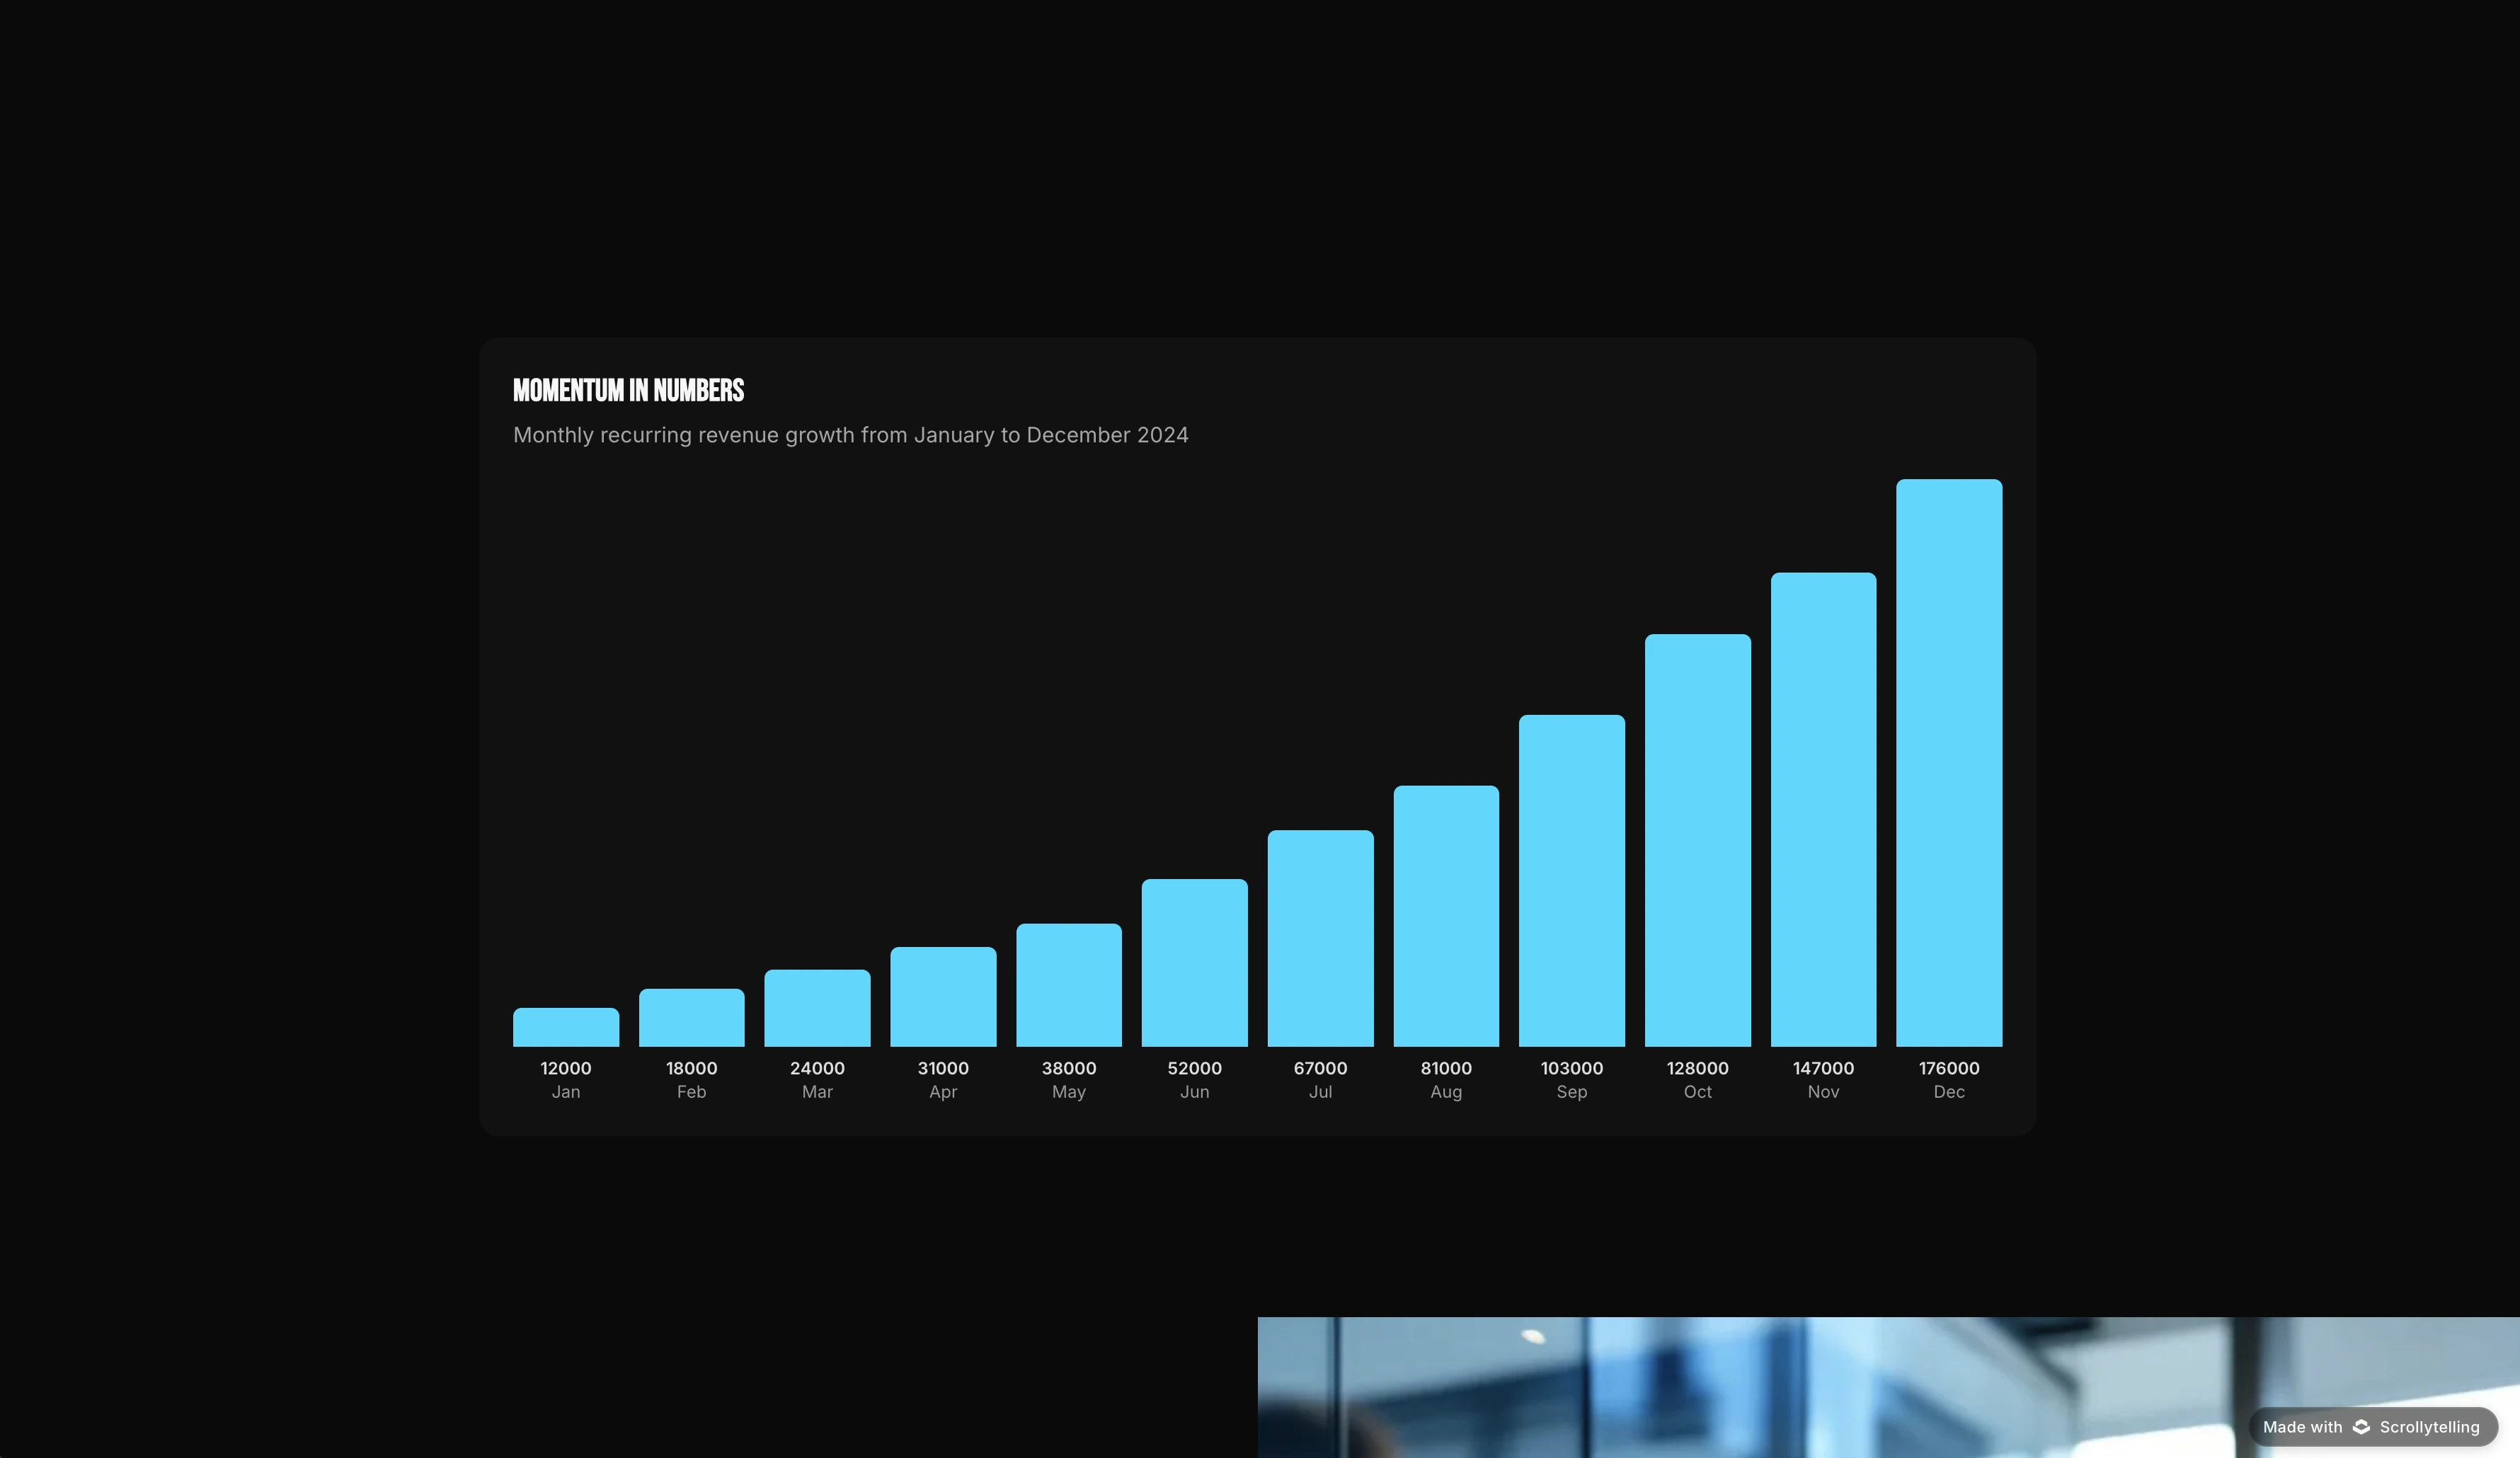
Accessibility, properly
This is the check most often waved through in procurement and most likely to matter afterwards, particularly for public bodies, universities and charities with statutory duties.
The web version has a structural advantage. HTML carries the semantics assistive technology already understands: real headings, real lists, real tables with header cells, alt text, and a focus order that follows the document. WCAG 2.2, published by the W3C in October 2023 and updated in December 2024, is written against exactly that model. A PDF has to be deliberately tagged to reach the same place, which is why W3C maintains a separate set of PDF techniques and why the ISO 14289 (PDF/UA) standard exists. Design-tool exports are frequently untagged.
The advantage is only potential. Interactive reports fail in four predictable ways, and all four are the tool's fault as often as the author's:
- Charts as flat images. A revenue chart exported as a PNG with alt text reading "chart" conveys nothing. Fix it with a text alternative stating the actual trend, or a data table alongside.
- Content that only exists mid-scroll. If a figure or caption is rendered only when a scroll animation fires, it may never be announced.
- Ignoring reduced motion. Operating systems expose a "reduce motion" preference, and a report full of parallax that ignores it is unusable for people with vestibular disorders.
- Contrast on image overlays. White text over a photograph is the signature look of this format and its most common contrast failure. Test the real photos.
If you ship both formats, decide which is the accessible version of record and say so on the page.
Permanence and ownership
Annual reports get cited. Journalists link to them, researchers reference them, funders pull them up in due diligence years later. That makes URL stability a requirement rather than an IT detail — and the web is bad at it. Pew Research Center's 2024 study of digital decay found that 38% of pages that existed in 2013 were no longer accessible a decade later, most often because a single page was removed from a site that still works fine.
Doing better is possible. Mozilla's 2012 State of Mozilla annual report is still live on mozilla.org more than a decade on, alongside the 2010, 2011 and 2013 editions at matching paths, because each is an ordinary web page on a domain the organisation controls. The Wikimedia Foundation publishes its 2024–2025 annual report the same way — jump navigation, story carousels, an interactive map, with the PDF offered as a download rather than as the primary artefact. Neither depends on a vendor continuing to host it.
Two protections give you that property whichever tool you pick: publish on a domain you own, so the URL survives a migration; and insist on an export that produces a self-contained copy you can host anywhere. Together they turn "we publish on a platform" into "we publish on the web, using a platform".
How to run the evaluation in a week
Do not evaluate against a feature matrix. Evaluate against last year's report.
- Pick the hard chapter. Not the CEO letter — the one with a comparative table, two charts and a restated figure. That is where tools break.
- Rebuild it in each shortlisted tool, yourself. Not the vendor's demo team. Two hours per tool teaches you everything a sales call will not.
- Open each result on a phone. Then a screen reader. Then with reduced motion enabled in your OS settings.
- Change a number in the published version and time it. Best available proxy for what next year's corrections will cost.
- Try to export it. Get the files out, or discover that you cannot.
- Price the real year. Count every publication you will make, translations and half-year update included, and multiply.
For a structure to rebuild against, the content checklist lists the sections most reports need and how to write an annual report covers the narrative order; annual report examples shows company, nonprofit and internal variants side by side.
Where we fit, honestly
Scrollytelling is an AI-first builder, which makes it the right answer for part of this category and the wrong one for the rest.
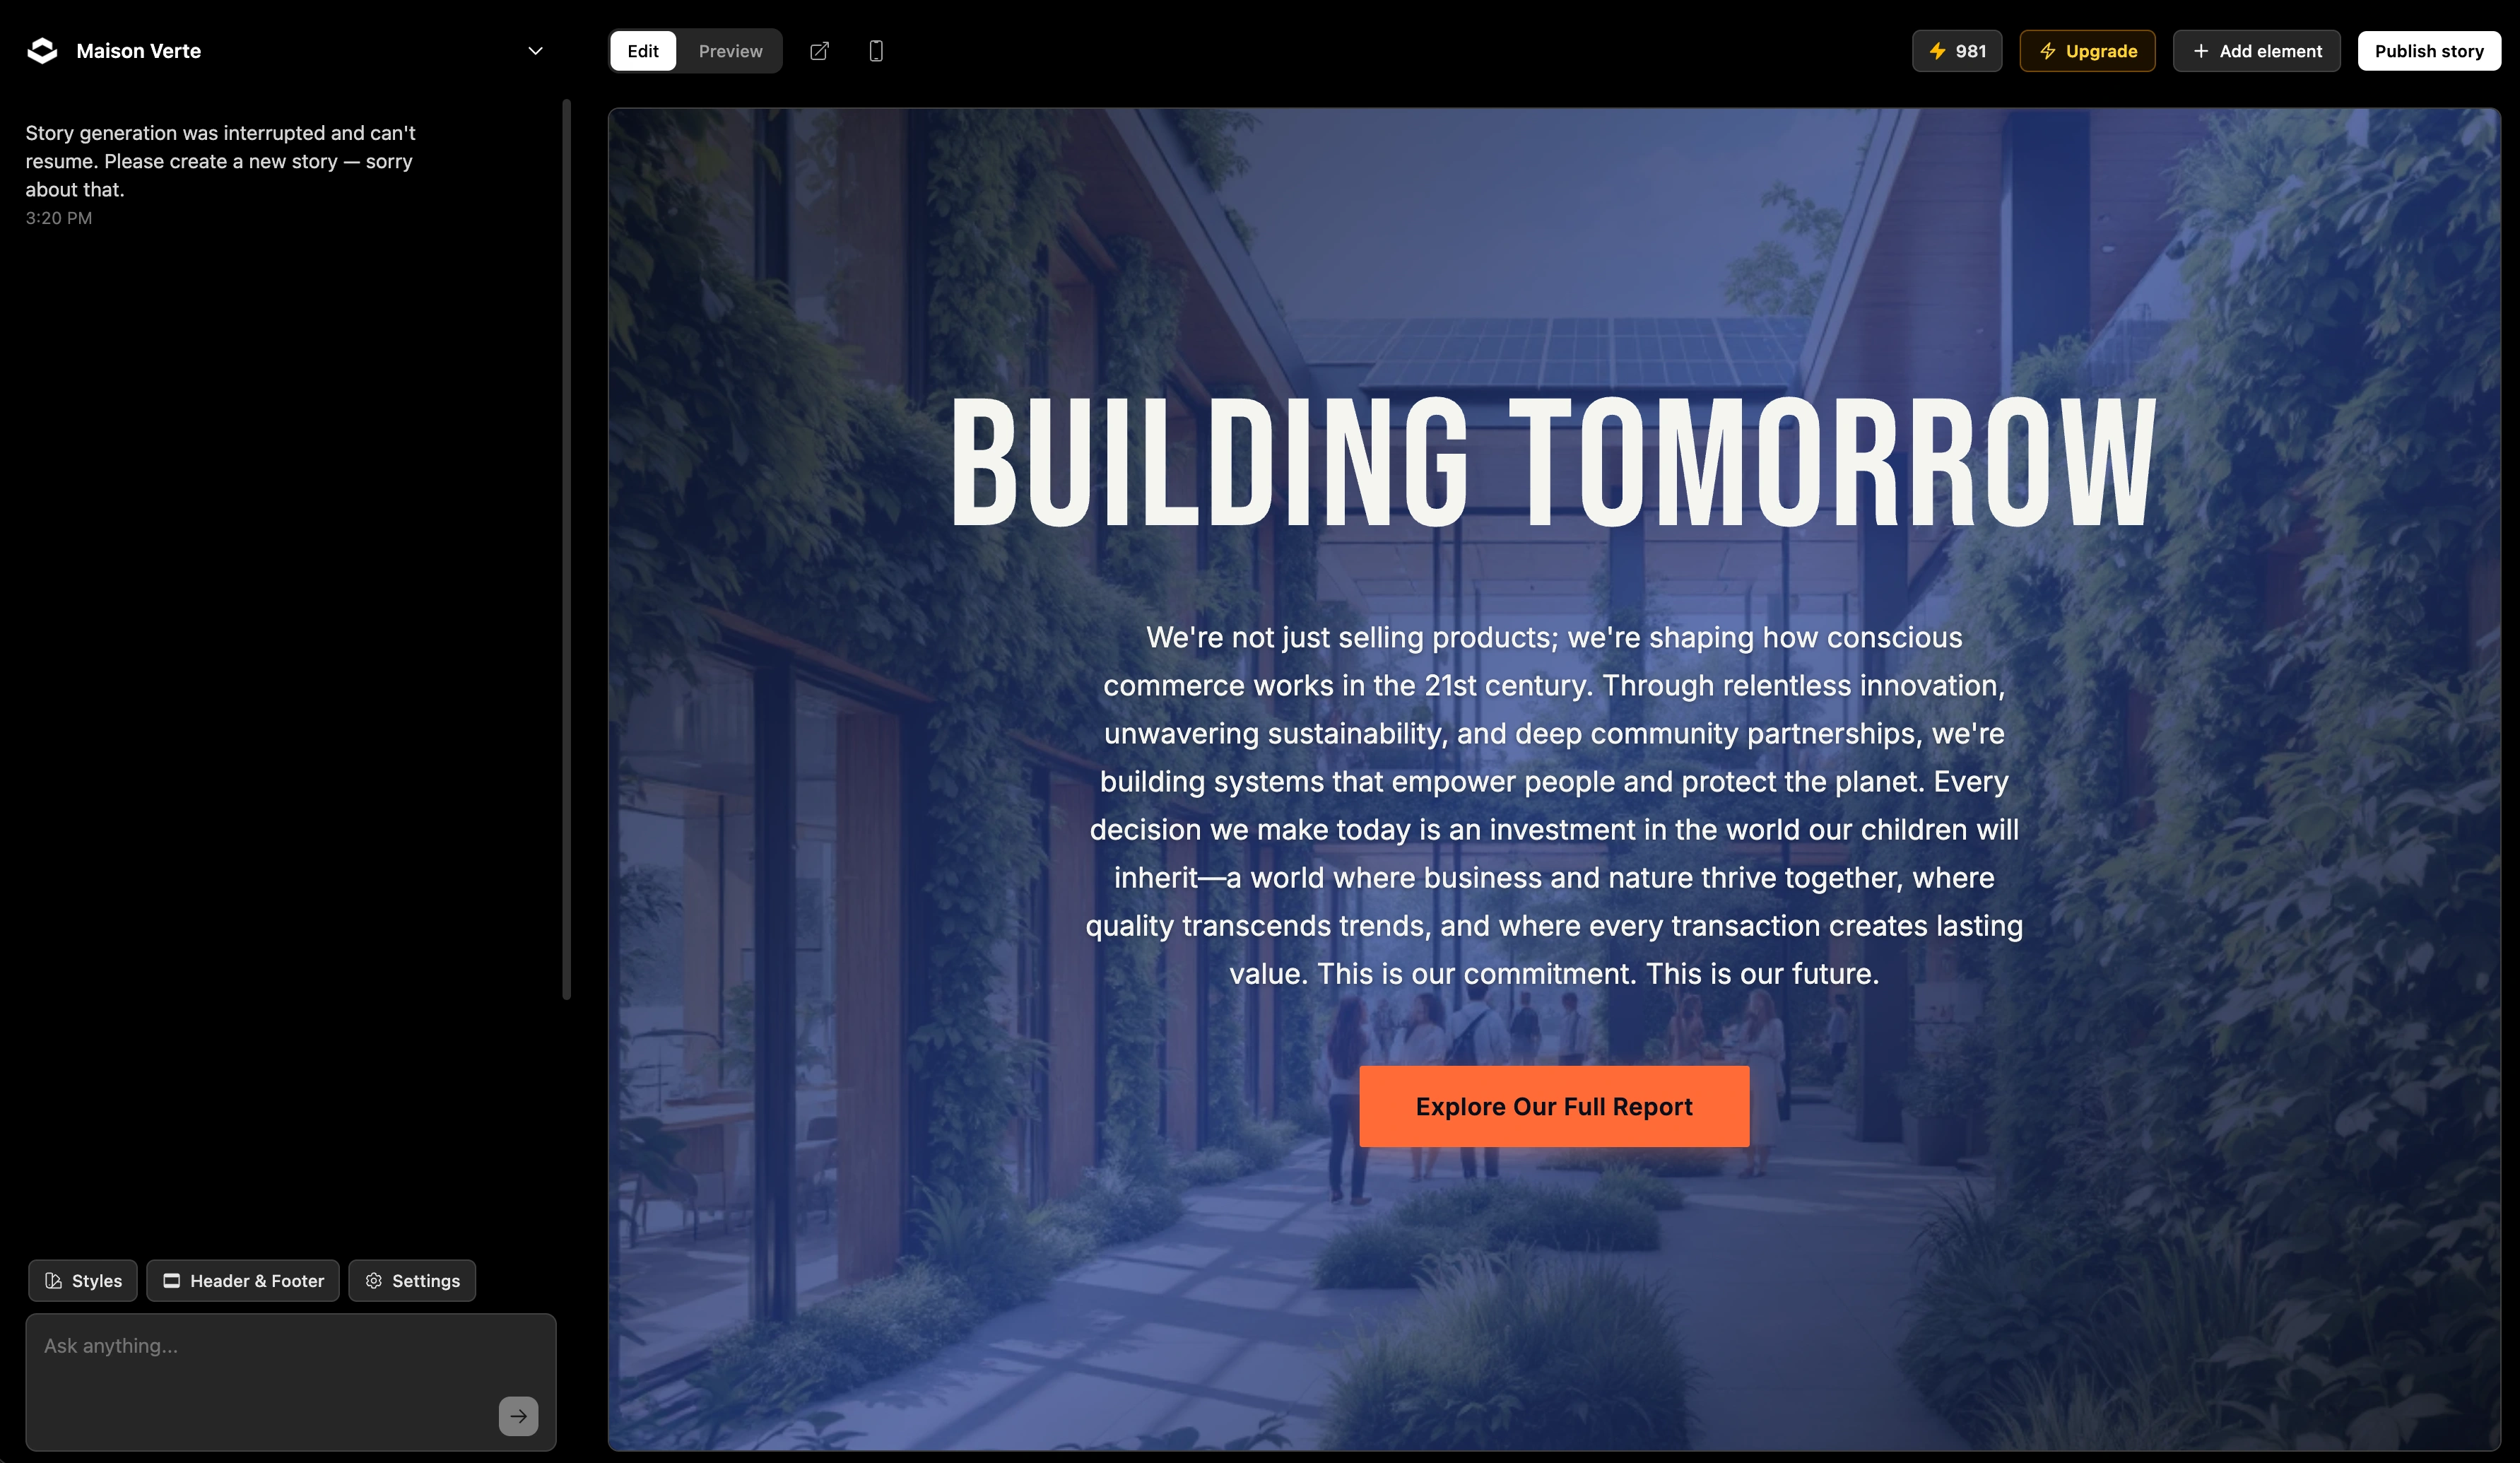
It fits when a small team has to publish a good-looking report on a short calendar and a real budget. You describe the year, the tool drafts structure, copy and imagery, and you edit every word and colour in a visual editor. Reports are responsive by default, publish to a link or a custom domain, embed into WordPress, and on Pro+ export as a self-contained ZIP — index.html plus every image, video and font — that runs offline with no dependency on us. As of September 2026 there is a free tier, Pro is $29/month and Pro+ is $59/month.
It does not fit when the report is a flagship brand production with bespoke illustration and a custom interaction on every spread. That is a job for an agency or an in-house build. It also does not touch your ESEF filing or your 10-K.
Frequently asked questions
What is interactive annual report software?
Software that publishes your annual report as a web page rather than a file: a scrollable, responsive page with navigation, charted figures, video and images, hosted at a URL you can send to anyone. It targets the narrative report you write for staff, donors, customers and non-specialist shareholders, not the statutory filing your finance team submits to a regulator.
Does an interactive annual report replace the statutory filing?
No, and no vendor should tell you otherwise. EU issuers covered by the Transparency Directive publish their annual financial report in XHTML with Inline XBRL tagging under the ESEF rules; US domestic registrants file a Form 10-K with the SEC. Those are compliance artefacts with their own tooling. The interactive report is the version a human reads. Budget for both.
How much does interactive annual report software cost?
It splits into two worlds. Enterprise digital-publishing platforms mostly publish no list prices at all: as of August 2026, all four Foleon plans carry a request-a-quote button, and Ceros shows a free Starter tier plus Growth and Enterprise tiers that route to sales — no numbers on either site. Shorthand is the transparent exception, listing Starter at $60 per month billed yearly with 12 published stories a year, Team at $875 and Business at $1,750. Self-serve tools sit an order of magnitude lower — Scrollytelling's Pro plan is $29 per month and Pro+ is $59 per month as of September 2026. Convert whatever you compare into a cost per published report, because per-story fees are where the spend hides.
Can an interactive annual report be accessible?
Usually more easily than a PDF. HTML carries semantics assistive technology already understands — headings, lists, tables, alt text, focus order — and WCAG 2.2 was written for it, whereas a PDF has to be deliberately tagged to reach the same place. The web-side failures are self-inflicted: charts as flat images with no text alternative, content that only appears if you scroll with a mouse, and animation that ignores the reduced-motion preference.
Do we still need a PDF version?
Most organisations do. Auditors, grant officers, board packs and archives still want a fixed document. The question to put to a vendor is how that PDF gets produced: exported from the same content, maintained as a separate layout, or your problem. Answer it during evaluation, not in week eleven.
What happens to the report if we stop paying?
Ask in writing before you sign, because public pricing pages almost never say. If hosting for reports you already published stops with the subscription, several years of work quietly leave the web. The protections are a custom domain you control, so the URL can be redirected, and an export that produces a self-contained folder of HTML and assets you can host anywhere.
Test the category with your own report
Rebuild one chapter of last year's report and see what an interactive version actually reads like. Free to try, no card.
Start building → Use the annual report maker →